session-stats
/session-stats opens a live pane with CPU, RAM and the process tree of this Claude session
panebandcommandtoastpromptprocess

/session-stats opens a live pane with CPU, RAM and the process tree of this Claude session
A Claude Code mod that shows how hard your Claude Code sessions are working your machine: which prompt was expensive, how much battery it took, and how much all your open Claude windows draw together. It's easy to send a prompt that sets off minutes of builds, tests and subprocesses without noticing; with several windows open, that can saturate a laptop and drain the battery in an hour.
Type /session-stats and a pane opens with:
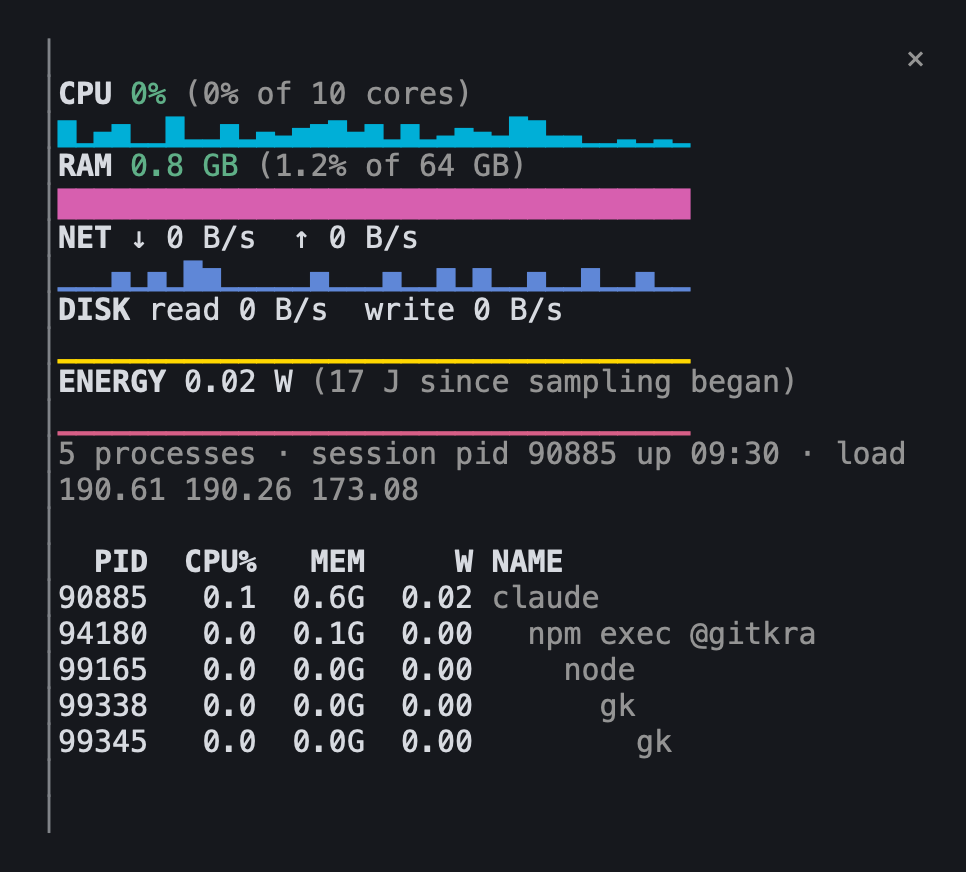
claude process plus every shell, build, test runner and stdio MCP server it started), with sparklines of up to the last 4 minutesIt samples while the pane, the bar or a prompt needs it, at the rate the mode sets, and stops when nothing does.
/session-stats bar toggles a one-line strip above the prompt:

After the histories the strip shows the session's power draw right now, then how much of the battery this session has used since you last unplugged:
⚡ 0.42 W  🔋 0.31% used        (on battery)
⚡ 0.42 W  🔌                   (on AC power)
The battery count covers this session's processes while on battery; plugging in pauses it and the next unplug starts it over. A session that starts on battery counts from then. /session-stats bar prompt on also shows each prompt's energy in joules (120 J now while one runs, 1.2 kJ last after). Each history is up to 30 cells wide (one minute) from the start and fills left to right, then scrolls. Click the strip to open the full pane. The setting is remembered across sessions; /session-stats bar on and /session-stats bar off set it directly.
The bar is meant to stay on, so the monitor's own cost is yours to set with /session-stats mode (remembered across sessions):
| Mode | Samples | Shows on the bar | Monitor's own cost |
|---|---|---|---|
lite (default) | every 10 s, one cheap ps and the energy probe | CPU, RAM, power, battery used | about 1% of one core |
normal | every 5 s, plus the energy probe | the same, with live energy and disk for the pane | about 3% |
full | every 2 s, everything | the same, at the finest resolution | about 7% |
In every mode:
lite, for about 0.1 s of CPU per prompt.full while it's open (network too) and drops back when closed./session-stats mode with no argument shows the current mode; the pane shows the measured cost.
/session-stats stop (or off, or kill) closes the pane, turns the bar off and stops all sampling, so the mod runs nothing until you call it again.
At the prompt of a Claude Code terminal session:
/plugin install session-stats --marketplace toml0006/session-activity-monitorAnswer y to add the marketplace, then pick a scope. From a shell:
claude plugin install session-stats --marketplace toml0006/session-activity-monitorsysctl hw.memsize and vm.loadavg and macOS ps output.claude process, so they're part of its numbers, not separate rows.ps's smoothed recent average and can pass 100% on multiple cores.nettop, which takes about 5 seconds per sample, so it updates about every 5 seconds. A background session (claude --bg) sends its API traffic through the shared daemon, so that traffic isn't counted under the session.tccd, launchservicesd and runningboardd for ~45% CPU on one machine).proc_pid_rusage (what Activity Monitor reads), called through the system python3. They need the Xcode Command Line Tools; without them the pane says so rather than triggering an install prompt. Energy needs macOS 13 or later.claude plugin validate .
claude plugin test .
claude --plugin-dir .MIT
hooks/register.tsx 568 lines1import { atom, read, update } from 'claude-code'
2import type { EngineInterface, Register, Timer } from 'claude-code'
3
4import type { Io, Mode, Snapshot, Stats, Turn } from '../types'
5import type { Counters } from './stats'
6import {
7 BATTERY_PROBE,
8 NET_PROBE,
9 POWER_SOURCE_PROBE,
10 PROBE,
11 SLIM_PROBE,
12 bytes,
13 gb,
14 ioProbe,
15 joules,
16 parseBattery,
17 parseNettop,
18 parsePowerSource,
19 parseProbe,
20 parseRusage,
21 parseSlim,
22 parseTimes,
23 rates,
24 sparkline,
25 watts,
26} from './stats'
27
28const PANE = 'session-stats'
29// What each mode costs, measured on an M-series Mac: the full ps is ~86 ms of CPU,
30// the nameless one ~44 ms, the python energy probe ~55 ms, nettop ~128 ms
31const MODES: Record<Mode, { ms: number; note: string }> = {
32 lite: { ms: 10000, note: 'every 10 s, CPU, RAM and power, about 1% of one core' },
33 normal: { ms: 5000, note: 'every 5 s, with live energy and disk, about 3% of one core' },
34 full: { ms: 2000, note: 'every 2 s, everything, about 7% of one core (plus nettop with the pane open)' },
35}
36const MODE_KEY = 'mode'
37const BAR_PROMPT_KEY = 'barPrompt'
38const POWER_CHECK_MS = 60_000
39const HISTORY = 120
40// Each history in the bar is at most this many cells (one minute of samples)
41const BAR_SPAN = 30
42const BAR_KEY = 'bar'
43// A prompt whose tree used at least this much energy raises a toast
44const TOAST_JOULES = 300
45const EMPTY: Stats = {
46 snapshot: null,
47 error: null,
48 cpuHistory: [],
49 ramHistory: [],
50 io: null,
51 isRusageAvailable: true,
52 net: null,
53 netHistory: [],
54 diskHistory: [],
55 energyHistory: [],
56 allWatts: null,
57 cpuSeconds: 0,
58 turn: null,
59 lastTurn: null,
60 batteryWh: null,
61 ownCpuSeconds: 0,
62 ownSince: null,
63 isOnBattery: null,
64 batteryJoules: 0,
65 batterySince: null,
66}
67const stats = atom({ plugin: 'session-stats', key: 'stats' } as const, EMPTY)
68const isBarOn = atom({ plugin: 'session-stats', key: 'isBarOn' } as const, false)
69const modeAtom = atom({ plugin: 'session-stats', key: 'mode' } as const, 'lite' as Mode)
70// Per-prompt joules on the bar: off by default, the bar leads with watts and battery
71const isBarPromptOn = atom({ plugin: 'session-stats', key: 'isBarPromptOn' } as const, false)
72
73// "<0.01%" for a trace, two decimals under 1%, one above
74const batteryShare = (j: number, wh: number) => {
75 const pct = (j / (wh * 3600)) * 100
76 return pct > 0 && pct < 0.01 ? '<0.01%' : `${pct.toFixed(pct >= 1 ? 1 : 2)}%`
77}
78
79const wattsColor = (w: number) => (w >= 5 ? 'red' : w >= 1 ? 'yellow' : 'green')
80const batteryColor = (j: number, wh: number | null) => {
81 const pct = wh ? (j / (wh * 3600)) * 100 : 0
82 return pct >= 5 ? 'red' : pct >= 2 ? 'yellow' : 'green'
83}
84const clockTime = (ms: number) => new Date(ms).toTimeString().slice(0, 5)
85
86// "0.31% of the battery used by this session since 08:12" or "on AC power"
87function batterySummary(st: Stats): string {
88 if (st.isOnBattery === null) return 'battery: unknown'
89 if (!st.isOnBattery) return 'on AC power'
90 const used = st.batteryWh ? batteryShare(st.batteryJoules, st.batteryWh) : joules(st.batteryJoules)
91 return `${used} of the battery used by this session${st.batterySince ? ` since ${clockTime(st.batterySince)}` : ''}`
92}
93
94const joulesColor = (j: number) => (j >= TOAST_JOULES ? 'red' : j >= TOAST_JOULES / 3 ? 'yellow' : 'green')
95const duration = (sec: number) => (sec >= 60 ? `${Math.floor(sec / 60)}m${String(Math.round(sec % 60)).padStart(2, '0')}s` : `${sec.toFixed(0)}s`)
96
97const cpuColor = (cpu: number) => (cpu >= 100 ? 'red' : cpu >= 50 ? 'yellow' : 'green')
98const ramColor = (kb: number) => (kb >= 4194304 ? 'red' : kb >= 2097152 ? 'yellow' : 'green')
99
100// One sampler serves the bar, the pane and a running prompt, and runs only
101// while one of them needs it. A reload resets these; session.start restarts it.
102let timer: Timer | undefined
103let isPaneOpen = false
104let isTurnRunning = false
105let prevSampleAt: number | undefined
106let timerMs = 0
107let mode: Mode = 'lite'
108// When this session last drew the bar: a session that doesn't draw it (a
109// background spare, no surface attached) has no reason to sample for it
110let lastBarDrawnAt: number | undefined
111let lastPowerCheckAt: number | undefined
112
113// The pane shows everything, so it samples at full while it's open
114const effectiveMode = (): Mode => (isPaneOpen ? 'full' : mode)
115
116// The previous cumulative counters, to turn the next ones into rates
117let prevRusage: { at: number; counters: Counters } | undefined
118let prevNet: { at: number; counters: Counters } | undefined
119let isNetBusy = false
120
121const push = (list: readonly number[], v: number) => [...list, v].slice(-HISTORY)
122
123// The host keeps $.state across reloads and updates, so a value written by an
124// older version can lack fields this one reads: fill them in on every read.
125async function readStats($: EngineInterface): Promise<Stats> {
126 return { ...EMPTY, ...(await read($, stats)) }
127}
128
129async function updateStats($: EngineInterface, fn: (s: Stats) => Stats) {
130 await update($, stats, s => fn({ ...EMPTY, ...s }))
131}
132
133// "running 45s · 120 J (0.1% of battery) · 30 CPU-s · peak 3.2 cores"
134function promptSummary(st: Stats): string {
135 const t = st.turn ?? st.lastTurn
136 if (!t) return 'no prompt measured yet'
137 const energy = st.batteryWh ? `${batteryShare(t.joules, st.batteryWh)} of battery (${joules(t.joules)})` : joules(t.joules)
138 return `${st.turn ? 'running' : 'last'} ${duration(t.seconds)} · ${energy} · ${t.cpuSeconds.toFixed(0)} CPU-s · peak ${(t.peakCpu / 100).toFixed(1)} cores`
139}
140
141// A periodic tick: skipped when only an undrawn bar wants it, the nameless ps
142// in lite, the full probe otherwise. `force` (a prompt's start and end, the
143// sampler starting) always takes a full reading with energy.
144async function sample($: EngineInterface, force = false) {
145 try {
146 const now = await $.clock.now()
147 const isBarUnseen = lastBarDrawnAt === undefined || now - lastBarDrawnAt > 3 * MODES[effectiveMode()].ms + 2000
148 if (!force && !isPaneOpen && !isTurnRunning && isBarUnseen) return
149 await checkPower($, now)
150 const { snapshot } = await readStats($)
151 if (!force && effectiveMode() === 'lite' && snapshot && (await sampleSlim($, snapshot))) return
152
153 const ps = await $.process.run(PROBE, { env: { LC_ALL: 'C' }, timeoutMs: 5000 })
154 const snap = parseProbe(ps.stdout)
155 const pids = snap.procs.map(p => p.pid)
156
157 // One rusage call covers every Claude tree, so this session's share is known
158 const probe = ioProbe(snap.allClaude.pids)
159 const io$ = await $.process.run(probe.argv, { env: probe.env, timeoutMs: 5000 })
160 const usage = parseRusage(io$.stdout)
161 const at = await $.clock.now()
162 const sinceLast = prevSampleAt === undefined ? 0 : (at - prevSampleAt) / 1000
163 prevSampleAt = at
164
165 let io: Io | null = null
166 let allWatts: number | null = null
167 let seconds = 0
168 if (prevRusage && usage.size > 0) {
169 seconds = (at - prevRusage.at) / 1000
170 const { total, perPid } = rates(prevRusage.counters, usage, seconds, pids)
171 const hasEnergy = [...usage.values()].every(c => (c[2] ?? -1) >= 0)
172 for (const p of snap.procs) {
173 const r = perPid.get(p.pid)
174 p.watts = r && hasEnergy ? (r[2] ?? 0) / 1e9 : null
175 }
176 const watts = hasEnergy ? (total[2] ?? 0) / 1e9 : 0
177 io = { diskRead: total[0] ?? 0, diskWrite: total[1] ?? 0, watts, hasEnergy, joules: 0 }
178 if (hasEnergy) allWatts = (rates(prevRusage.counters, usage, seconds, snap.allClaude.pids).total[2] ?? 0) / 1e9
179 }
180 prevRusage = usage.size > 0 ? { at, counters: usage } : undefined
181 const cpuDelta = (snap.cpu / 100) * sinceLast
182 const ownDelta = parseTimes(ps.stdout) + parseTimes(io$.stdout)
183
184 await updateStats($, s => {
185 const energy = io ? io.watts * seconds : 0
186 const turn: Turn | null = s.turn && {
187 ...s.turn,
188 seconds: (at - s.turn.startedAt) / 1000,
189 joules: s.turn.joules + energy,
190 cpuSeconds: s.turn.cpuSeconds + cpuDelta,
191 peakCpu: Math.max(s.turn.peakCpu, snap.cpu),
192 }
193 return {
194 ...s,
195 snapshot: snap,
196 error: null,
197 cpuHistory: push(s.cpuHistory, snap.cpu),
198 ramHistory: push(s.ramHistory, snap.rssKb),
199 isRusageAvailable: usage.size > 0,
200 io: io ? { ...io, joules: (s.io?.joules ?? 0) + energy } : s.io,
201 diskHistory: io ? push(s.diskHistory, io.diskRead + io.diskWrite) : s.diskHistory,
202 energyHistory: io?.hasEnergy ? push(s.energyHistory, io.watts) : s.energyHistory,
203 allWatts: allWatts ?? s.allWatts,
204 batteryJoules: s.batteryJoules + (s.isOnBattery ? energy : 0),
205 cpuSeconds: s.cpuSeconds + cpuDelta,
206 turn,
207 ownCpuSeconds: s.ownCpuSeconds + ownDelta,
208 ownSince: s.ownSince ?? at,
209 }
210 })
211 if (isPaneOpen && !isNetBusy) void sampleNet($, pids)
212 } catch (err) {
213 await updateStats($, s => ({ ...s, error: String(err) }))
214 }
215}
216
217// Lite: CPU, RAM and power of the tree under the known root (no names, no
218// other sessions, no disk history). False when the root is gone, so the caller
219// takes a full reading instead.
220async function sampleSlim($: EngineInterface, snap: Snapshot): Promise<boolean> {
221 const { stdout } = await $.process.run(SLIM_PROBE, { env: { LC_ALL: 'C' }, timeoutMs: 5000 })
222 const tree = parseSlim(stdout, snap.rootPid)
223 if (!tree) return false
224 const probe = ioProbe(tree.pids)
225 const io$ = await $.process.run(probe.argv, { env: probe.env, timeoutMs: 5000 })
226 const usage = parseRusage(io$.stdout)
227 const at = await $.clock.now()
228 const sinceLast = prevSampleAt === undefined ? 0 : (at - prevSampleAt) / 1000
229 prevSampleAt = at
230 let io: Io | null = null
231 let seconds = 0
232 if (prevRusage && usage.size > 0) {
233 seconds = (at - prevRusage.at) / 1000
234 const { total } = rates(prevRusage.counters, usage, seconds, tree.pids)
235 const hasEnergy = [...usage.values()].every(c => (c[2] ?? -1) >= 0)
236 io = { diskRead: total[0] ?? 0, diskWrite: total[1] ?? 0, watts: hasEnergy ? (total[2] ?? 0) / 1e9 : 0, hasEnergy, joules: 0 }
237 }
238 if (usage.size > 0) prevRusage = { at, counters: usage }
239 const cpuDelta = (tree.cpu / 100) * sinceLast
240 const own = parseTimes(stdout) + parseTimes(io$.stdout)
241 const energy = io ? io.watts * seconds : 0
242 await updateStats($, s => ({
243 ...s,
244 io: io ? { ...io, joules: (s.io?.joules ?? 0) + energy } : s.io,
245 energyHistory: io?.hasEnergy ? push(s.energyHistory, io.watts) : s.energyHistory,
246 batteryJoules: s.batteryJoules + (s.isOnBattery ? energy : 0),
247 snapshot: s.snapshot && { ...s.snapshot, cpu: tree.cpu, rssKb: tree.rssKb },
248 error: null,
249 cpuHistory: push(s.cpuHistory, tree.cpu),
250 ramHistory: push(s.ramHistory, tree.rssKb),
251 cpuSeconds: s.cpuSeconds + cpuDelta,
252 turn: s.turn && {
253 ...s.turn,
254 seconds: (at - s.turn.startedAt) / 1000,
255 joules: s.turn.joules + energy,
256 cpuSeconds: s.turn.cpuSeconds + cpuDelta,
257 peakCpu: Math.max(s.turn.peakCpu, tree.cpu),
258 },
259 ownCpuSeconds: s.ownCpuSeconds + own,
260 ownSince: s.ownSince ?? at,
261 }))
262 return true
263}
264
265// On battery or AC, about once a minute. Unplugging (or the first look finding
266// the Mac on battery) starts the battery count from zero; plugging in pauses it.
267async function checkPower($: EngineInterface, at: number) {
268 if (lastPowerCheckAt !== undefined && at - lastPowerCheckAt < POWER_CHECK_MS) return
269 lastPowerCheckAt = at
270 const onBattery = await $.process
271 .run(POWER_SOURCE_PROBE, { timeoutMs: 5000 })
272 .then(r => parsePowerSource(r.stdout))
273 .catch(() => null)
274 await updateStats($, s => {
275 if (onBattery === s.isOnBattery) return s
276 if (onBattery) return { ...s, isOnBattery: true, batteryJoules: 0, batterySince: at }
277 return { ...s, isOnBattery: onBattery }
278 })
279}
280
281async function sampleNet($: EngineInterface, pids: readonly number[]) {
282 isNetBusy = true
283 try {
284 const { stdout } = await $.process.run(NET_PROBE, { timeoutMs: 15000 })
285 const counters = parseNettop(stdout)
286 const at = await $.clock.now()
287 const own = parseTimes(stdout)
288 await updateStats($, s => ({ ...s, ownCpuSeconds: s.ownCpuSeconds + own }))
289 if (prevNet) {
290 const { total } = rates(prevNet.counters, counters, (at - prevNet.at) / 1000, pids)
291 const net = { bytesIn: total[0] ?? 0, bytesOut: total[1] ?? 0 }
292 await updateStats($, s => ({ ...s, net, netHistory: push(s.netHistory, net.bytesIn + net.bytesOut) }))
293 }
294 prevNet = { at, counters }
295 } catch {
296 // Network is a nice-to-have: a failed nettop leaves the last reading
297 } finally {
298 isNetBusy = false
299 }
300}
301
302async function syncSampler($: EngineInterface) {
303 const isNeeded = isPaneOpen || isTurnRunning || (await read($, isBarOn))
304 const ms = MODES[effectiveMode()].ms
305 if (isNeeded && timer && timerMs !== ms) {
306 timer.cancel()
307 timer = undefined
308 }
309 if (isNeeded && !timer) {
310 await sample($, true)
311 timer = $.clock.every(ms, () => void sample($))
312 timerMs = ms
313 } else if (!isNeeded && timer) {
314 timer.cancel()
315 timer = undefined
316 prevSampleAt = undefined
317 }
318}
319
320// Closes the pane, turns the bar off (remembered), and stops every sampler
321async function stopAll($: EngineInterface) {
322 isPaneOpen = false
323 await $.store.set(BAR_KEY, false)
324 await update($, isBarOn, () => false)
325 await syncSampler($)
326 prevRusage = undefined
327 prevNet = undefined
328 await $.ui.close({ id: PANE }).catch(() => undefined)
329 return 'Session stats stopped: pane closed, bar off, nothing sampling. /session-stats starts it again.'
330}
331
332async function openPane($: EngineInterface) {
333 const opened = await $.ui.open({ id: PANE, title: 'Session stats' })
334 if (!opened.isPlaced) return `Session stats pane not shown: ${opened.reason}`
335 isPaneOpen = true
336 await syncSampler($)
337 return 'Session stats pane opened.'
338}
339
340export const register: Register = on => {
341 on('session.start', async ($, e, next) => {
342 await $.command.register({
343 name: 'session-stats',
344 description:
345 'Show live CPU, RAM and processes of this session; "bar" toggles the strip above the prompt, "mode" sets how much the monitor itself costs, "stop" shuts everything off',
346 argumentHint: '[bar [on|off|prompt [on|off]] | mode [lite|normal|full] | stop]',
347 })
348 const isOn = (await $.store.get(BAR_KEY)) === true
349 await update($, isBarOn, () => isOn)
350 const stored = await $.store.get(MODE_KEY)
351 mode = stored === 'normal' || stored === 'full' ? stored : 'lite'
352 await update($, modeAtom, () => mode)
353 const isPromptOn = (await $.store.get(BAR_PROMPT_KEY)) === true
354 await update($, isBarPromptOn, () => isPromptOn)
355 const batteryWh = await $.process
356 .run(BATTERY_PROBE, { timeoutMs: 5000 })
357 .then(r => parseBattery(r.stdout))
358 .catch(() => null)
359 await updateStats($, s => ({ ...s, batteryWh }))
360 // A reload keeps an open pane open but forgets it here; ask, so it keeps updating
361 isPaneOpen = await $.ui
362 .panes()
363 .then(panes => panes.some(pane => pane.id === PANE))
364 .catch(() => false)
365 await syncSampler($)
366 return next(e)
367 })
368
369 // A prompt's cost: sample from its submit to its turn's end, whatever is showing
370 on('prompt.submit', async ($, e, next) => {
371 // A full reading first is the prompt's baseline, so earlier energy isn't counted
372 isTurnRunning = true
373 if (timer) await sample($, true)
374 await syncSampler($)
375 const startedAt = await $.clock.now()
376 await updateStats($, s => ({ ...s, turn: { startedAt, seconds: 0, joules: 0, cpuSeconds: 0, peakCpu: 0 } }))
377 return next(e)
378 })
379
380 on('turn.complete', async ($, e, next) => {
381 // A subagent's turn ends inside the prompt's; only the main loop's ends it
382 if (e.agentId !== undefined) return next(e)
383 // A full reading at the end, so even lite counts the prompt's whole energy
384 await sample($, true)
385 const { turn, batteryWh } = await readStats($)
386 isTurnRunning = false
387 if (turn) {
388 const done = { ...turn, seconds: ((await $.clock.now()) - turn.startedAt) / 1000 }
389 await updateStats($, s => ({ ...s, turn: null, lastTurn: done }))
390 if (done.joules >= TOAST_JOULES) {
391 const peak = `peak ${(done.peakCpu / 100).toFixed(1)} cores`
392 $.ui.toast(
393 batteryWh
394 ? `That prompt used ${batteryShare(done.joules, batteryWh)} of your battery (${joules(done.joules)}, ${peak})`
395 : `That prompt used ${joules(done.joules)} (${peak})`,
396 )
397 }
398 }
399 await syncSampler($)
400 return next(e)
401 })
402
403 on('command.run', { command: 'session-stats' }, async ($, e) => {
404 const [sub, arg] = e.args.trim().split(/\s+/)
405 if (sub === 'stop' || sub === 'off' || sub === 'kill') return { text: await stopAll($) }
406 if (sub === 'mode') {
407 const list = (Object.keys(MODES) as Mode[]).map(m => `${m}: ${MODES[m].note}`).join('; ')
408 if (!arg) return { text: `Mode ${mode}. ${list}. The pane runs full while it's open.` }
409 if (!(Object.keys(MODES) as string[]).includes(arg)) return { text: `Unknown mode "${arg}". ${list}.` }
410 mode = arg as Mode
411 await $.store.set(MODE_KEY, mode)
412 await update($, modeAtom, () => mode)
413 await syncSampler($)
414 return { text: `Session stats mode ${mode}: ${MODES[mode].note}.` }
415 }
416 if (sub !== 'bar') return { text: await openPane($) }
417 if (arg === 'prompt') {
418 const choice = e.args.trim().split(/\s+/)[2]
419 const isOn = choice === 'on' ? true : choice === 'off' ? false : !(await read($, isBarPromptOn))
420 await $.store.set(BAR_PROMPT_KEY, isOn)
421 await update($, isBarPromptOn, () => isOn)
422 return { text: `Prompt energy on the bar ${isOn ? 'on' : 'off'}.` }
423 }
424
425 const isOn = arg === 'on' ? true : arg === 'off' ? false : !(await read($, isBarOn))
426 await $.store.set(BAR_KEY, isOn)
427 await update($, isBarOn, () => isOn)
428 await syncSampler($)
429 return { text: `Session stats bar ${isOn ? 'on' : 'off'}.` }
430 })
431
432 on('ui.close', { id: PANE }, async ($, e, next) => {
433 isPaneOpen = false
434 await syncSampler($)
435 return next(e)
436 })
437
438 // The strip above the prompt: numbers first, then each history at its full
439 // width from the first sample, filling left to right and then scrolling. One
440 // Button, so a click anywhere on it opens the pane.
441 on('ui.render', { component: 'AbovePrompt' }, async ($, e, next) => {
442 if (e.props.hasSurvey || !(await read($, isBarOn))) return next(e)
443 lastBarDrawnAt = await $.clock.now()
444
445 const { Button, Text } = $.ui.resolve(e)
446 const st = await readStats($)
447 const { snapshot: s, cpuHistory, ramHistory, turn, lastTurn, io } = st
448 const width = e.props.bodyColumns ?? e.viewport?.columns ?? 80
449 // Power now, then the battery this session used since the last unplug
450 const power = ` ⚡ ${io?.hasEnergy ? watts(io.watts) : '…'}`
451 const battery =
452 st.isOnBattery && st.batteryWh
453 ? ` 🔋 ${batteryShare(st.batteryJoules, st.batteryWh)} used`
454 : st.isOnBattery === false
455 ? ' 🔌'
456 : ''
457 // Optional: the prompt's energy, the one running or else the last one
458 const shown = (await read($, isBarPromptOn)) ? (turn ?? lastTurn) : null
459 const prompt = shown ? ` ${joules(shown.joules)} ${turn ? 'now' : 'last'}` : ''
460 // Emoji draw two cells wide: one more each than their length counts
461 const extra = power.length + battery.length + prompt.length + (battery ? 2 : 1)
462 // "⚙ CPU 100% " + " " + " RAM 10.0G " + " " is 26 cells around the two histories
463 const span = Math.max(6, Math.min(BAR_SPAN, Math.floor((width - 26 - extra) / 2)))
464 const cpu = sparkline(cpuHistory.slice(-span))
465 const ram = sparkline(ramHistory.slice(-span))
466
467 return (
468 <Button key="open-pane" plain onPress={() => void openPane($)}>
469 <Text dimColor>⚙ CPU </Text>
470 <Text color={cpuColor(s?.cpu ?? 0)}>{(s ? `${s.cpu.toFixed(0)}%` : '…').padStart(4)} </Text>
471 <Text color="cyan">{cpu}</Text>
472 <Text dimColor>{'·'.repeat(span - cpu.length)} RAM </Text>
473 <Text color={ramColor(s?.rssKb ?? 0)}>{(s ? `${gb(s.rssKb)}G` : '…').padStart(5)} </Text>
474 <Text color="magenta">{ram}</Text>
475 <Text dimColor>{'·'.repeat(span - ram.length)}</Text>
476 <Text color={io?.hasEnergy ? wattsColor(io.watts) : undefined} dimColor={!io?.hasEnergy}>{power}</Text>
477 {battery && <Text color={st.isOnBattery ? batteryColor(st.batteryJoules, st.batteryWh) : undefined} dimColor={!st.isOnBattery}>{battery}</Text>}
478 {shown && <Text color={joulesColor(shown.joules)}>{prompt}</Text>}
479 </Button>
480 )
481 })
482
483 on('ui.render', { component: 'Pane', requestId: PANE }, async ($, e) => {
484 const { Box, Text } = $.ui.resolve(e)
485 const st = await readStats($)
486 const { snapshot: s, error, cpuHistory, ramHistory, io, net, netHistory, diskHistory, energyHistory, isRusageAvailable } = st
487 const now = await $.clock.now()
488 const chosen = await read($, modeAtom)
489 const width = e.props.bodyColumns ?? e.viewport?.columns ?? 80
490 const noRusage = isRusageAvailable ? null : 'needs the Xcode Command Line Tools'
491
492 if (!s) return <Text dimColor>{error ?? 'Sampling…'}</Text>
493
494 const machinePct = (s.cpu / s.cores).toFixed(0)
495 const ramPct = ((s.rssKb * 1024 * 100) / s.memBytes).toFixed(1)
496 const spark = Math.max(10, Math.min(HISTORY, width - 14))
497 const room = Math.max(3, (e.viewport?.rows ?? 30) - 21)
498 const nameCols = Math.max(10, width - 31)
499 const pad = (v: string, n: number) => v.padStart(n)
500
501 return (
502 <Box flexDirection="column">
503 <Text>
504 <Text bold>CPU </Text>
505 <Text color={cpuColor(s.cpu)}>{s.cpu.toFixed(0)}%</Text>
506 <Text dimColor> ({machinePct}% of {s.cores} cores)</Text>
507 </Text>
508 <Text color="cyan">{sparkline(cpuHistory.slice(-spark))}</Text>
509 <Text>
510 <Text bold>RAM </Text>
511 <Text color={ramColor(s.rssKb)}>{gb(s.rssKb)} GB</Text>
512 <Text dimColor> ({ramPct}% of {gb(s.memBytes / 1024)} GB)</Text>
513 </Text>
514 <Text color="magenta">{sparkline(ramHistory.slice(-spark))}</Text>
515 <Text>
516 <Text bold>NET </Text>
517 {net ? `↓ ${bytes(net.bytesIn)}/s ↑ ${bytes(net.bytesOut)}/s` : <Text dimColor>measuring…</Text>}
518 </Text>
519 <Text color="blue">{sparkline(netHistory.slice(-spark))}</Text>
520 <Text>
521 <Text bold>DISK </Text>
522 {io ? `read ${bytes(io.diskRead)}/s write ${bytes(io.diskWrite)}/s` : <Text dimColor>{noRusage ?? 'measuring…'}</Text>}
523 </Text>
524 <Text color="yellow">{sparkline(diskHistory.slice(-spark))}</Text>
525 <Text>
526 <Text bold>ENERGY </Text>
527 {io?.hasEnergy ? `${watts(io.watts)} now` : <Text dimColor>{io ? 'needs macOS 13 or later' : noRusage ?? 'measuring…'}</Text>}
528 <Text dimColor> · {batterySummary(st)}</Text>
529 </Text>
530 <Text color="red">{sparkline(energyHistory.slice(-spark))}</Text>
531 <Text>
532 <Text bold>PROMPT </Text>
533 {promptSummary(st)}
534 </Text>
535 <Text>
536 <Text bold>ALL CLAUDE </Text>
537 {s.allClaude
538 ? `${s.allClaude.trees} trees · ${st.allWatts === null ? '…' : st.allWatts.toFixed(2)} W · ${s.allClaude.cpu.toFixed(0)}% CPU · ${gb(s.allClaude.rssKb)} GB`
539 : '…'}
540 {s.allClaude && st.allWatts && io?.hasEnergy ? (
541 <Text dimColor> · this session {((io.watts / st.allWatts) * 100).toFixed(0)}% of the power</Text>
542 ) : null}
543 </Text>
544 <Text dimColor>
545 mode {chosen}
546 {chosen === 'full' ? '' : ' (full while this pane is open)'}
547 {st.ownSince !== null && now > st.ownSince
548 ? ` · monitor itself: ${((st.ownCpuSeconds / ((now - st.ownSince) / 1000)) * 100).toFixed(1)}% of one core`
549 : ''}
550 </Text>
551 <Text dimColor>
552 {s.procs.length} processes · session pid {s.rootPid} up {s.procs[0]?.elapsed} · load {s.load.map(l => l.toFixed(2)).join(' ')}
553 </Text>
554 <Text> </Text>
555 <Text bold>{' PID CPU% MEM W NAME'}</Text>
556 {s.procs.slice(0, room).map(p => (
557 <Text>
558 {pad(String(p.pid), 5)} {pad(p.cpu.toFixed(1), 5)} {pad(gb(p.rssKb) + 'G', 5)} {pad(p.watts == null ? '–' : p.watts.toFixed(2), 5)}{' '}
559 <Text dimColor={p.cpu < 1}>{(' '.repeat(p.depth) + p.name).slice(0, nameCols)}</Text>
560 </Text>
561 ))}
562 {s.procs.length > room && <Text dimColor>…{s.procs.length - room} more</Text>}
563 {error && <Text color="red">last sample failed: {error}</Text>}
564 </Box>
565 )
566 })
567}
568hooks/stats.ts 278 lines1import type { Proc, Snapshot } from '../types'
2
3// One shell call gathers everything: the spawner's pid (the engine, or a child
4// of it), machine facts, then every process. LC_ALL=C keeps ps's decimals dots.
5export const PROBE = [
6 '/bin/sh',
7 '-c',
8 'echo $PPID; sysctl -n hw.ncpu hw.memsize vm.loadavg; ps -axo pid=,ppid=,pcpu=,rss=,etime=,comm=; times',
9] as const
10
11/**
12 * CPU seconds a probe's own commands used, from the \`times\` its shell prints
13 * last (children's user and system time), so the monitor can report its cost.
14 */
15export function parseTimes(stdout: string): number {
16 const last = stdout.trim().split('\n').pop() ?? ''
17 const parts = [...last.matchAll(/(\d+)m([\d.]+)s/g)].map(m => Number(m[1]) * 60 + Number(m[2]))
18 return parts.length === 2 ? (parts[0] ?? 0) + (parts[1] ?? 0) : 0
19}
20
21const ROW = /^\s*(\d+)\s+(\d+)\s+([\d.]+)\s+(\d+)\s+(\S+)\s+(.*)$/
22
23const PROBE_COMMANDS = ['ps', 'nettop', 'Python', 'python3']
24
25// "claude bg-spare" and "/Users/x/.local/bin/claude" both name a claude process
26const isClaude = (name: string) => name.split(' ')[0]?.split('/').pop() === 'claude'
27
28// A full path may hold spaces ("Application Support"); a renamed title holds words
29const shortName = (name: string) => {
30 if (name.startsWith('/')) return name.split('/').pop() ?? name
31 const [head = '', ...rest] = name.split(' ')
32 return [head.split('/').pop(), ...rest].join(' ')
33}
34
35export function parseProbe(stdout: string): Snapshot {
36 const [spawner = '', ncpu, memsize, loadavg = '', ...rows] = stdout.trim().split('\n')
37
38 const all = new Map<number, Omit<Proc, 'depth' | 'watts'>>()
39 for (const row of rows) {
40 const m = ROW.exec(row)
41 if (!m) continue
42 const pid = Number(m[1])
43 all.set(pid, {
44 pid,
45 ppid: Number(m[2]),
46 cpu: Number(m[3]),
47 rssKb: Number(m[4]),
48 elapsed: m[5] ?? '',
49 name: (m[6] ?? '').trim(),
50 })
51 }
52
53 // The session is the nearest claude ancestor of whatever ran the probe
54 let rootPid = Number(spawner)
55 while (rootPid > 1 && !isClaude(all.get(rootPid)?.name ?? '')) {
56 rootPid = all.get(rootPid)?.ppid ?? 1
57 }
58 if (rootPid <= 1) throw new Error(`no claude process above pid ${spawner}`)
59
60 const children = new Map<number, Omit<Proc, 'depth' | 'watts'>[]>()
61 for (const p of all.values()) {
62 if (!children.has(p.ppid)) children.set(p.ppid, [])
63 children.get(p.ppid)!.push(p)
64 }
65
66 // Depth-first so the table reads as a tree; busiest siblings first. The probe's
67 // own sh and ps are left out, since they exist only because we asked.
68 // The mod's own probes: an sh under the spawner or the session running ps,
69 // nettop or python, and those children. They exist only because we asked.
70 const probePids = new Set<number>()
71 for (const sh of [...(children.get(Number(spawner)) ?? []), ...(children.get(rootPid) ?? [])]) {
72 const kids = children.get(sh.pid) ?? []
73 if (shortName(sh.name) === 'sh' && kids.some(k => PROBE_COMMANDS.includes(shortName(k.name)))) {
74 probePids.add(sh.pid)
75 for (const k of kids) probePids.add(k.pid)
76 }
77 }
78 const procs: Proc[] = []
79 // The io probes (nettop, and python under sh) are the session's direct children
80 const isIoProbe = (p: Omit<Proc, 'depth' | 'watts'>, depth: number) =>
81 depth === 1 && ['nettop', 'Python', 'python3'].includes(shortName(p.name))
82 const walk = (p: Omit<Proc, 'depth' | 'watts'>, depth: number) => {
83 if (probePids.has(p.pid) || isIoProbe(p, depth)) return
84 procs.push({ ...p, depth, name: shortName(p.name), watts: null })
85 const kids = [...(children.get(p.pid) ?? [])].sort((a, b) => b.cpu - a.cpu || b.rssKb - a.rssKb)
86 for (const k of kids) walk(k, depth + 1)
87 }
88 walk(all.get(rootPid)!, 0)
89
90 // Every Claude process tree on the machine: each process counts toward its
91 // nearest claude ancestor, so nested sessions (a background session under the
92 // daemon) are counted once, under the session that owns them.
93 const owner = new Map<number, number | null>()
94 const ownerOf = (pid: number): number | null => {
95 if (owner.has(pid)) return owner.get(pid)!
96 const p = all.get(pid)
97 const o = !p ? null : isClaude(p.name) ? pid : p.ppid > 1 ? ownerOf(p.ppid) : null
98 owner.set(pid, o)
99 return o
100 }
101 const trees = new Set<number>()
102 const claudePids: number[] = []
103 let allCpu = 0
104 let allRss = 0
105 for (const p of all.values()) {
106 const o = ownerOf(p.pid)
107 if (o === null || probePids.has(p.pid)) continue
108 trees.add(o)
109 claudePids.push(p.pid)
110 allCpu += p.cpu
111 allRss += p.rssKb
112 }
113
114 return {
115 rootPid,
116 rootName: shortName(all.get(rootPid)!.name),
117 allClaude: { trees: trees.size, cpu: allCpu, rssKb: allRss, pids: claudePids },
118 cores: Number(ncpu),
119 memBytes: Number(memsize),
120 load: loadavg.replace(/[{}]/g, '').trim().split(/\s+/).map(Number),
121 cpu: procs.reduce((s, p) => s + p.cpu, 0),
122 rssKb: procs.reduce((s, p) => s + p.rssKb, 0),
123 procs,
124 }
125}
126
127const BARS = '▁▂▃▄▅▆▇█'
128
129export function sparkline(values: readonly number[], max?: number): string {
130 const top = max ?? Math.max(1, ...values)
131 return values.map(v => BARS[Math.min(7, Math.max(0, Math.round((v / top) * 7)))]).join('')
132}
133
134export const gb = (kb: number) => (kb / 1048576).toFixed(kb >= 10485760 ? 0 : 1)
135
136// Disk and energy per process come from proc_pid_rusage (what Activity Monitor
137// reads), called through the system python. It runs only where the Command
138// Line Tools are installed, so a bare Mac never sees an install prompt; there
139// the probe prints nothing and the pane says why.
140const RUSAGE_PY = `
141import ctypes, sys
142lib = ctypes.CDLL('/usr/lib/libproc.dylib')
143class RU(ctypes.Structure):
144 _fields_ = [('uuid', ctypes.c_uint8 * 16)] + [('f%d' % i, ctypes.c_uint64) for i in range(56)]
145for pid in map(int, sys.argv[1:]):
146 r = RU()
147 if lib.proc_pid_rusage(pid, 6, ctypes.byref(r)) == 0:
148 print(pid, r.f16, r.f17, r.f40)
149 elif lib.proc_pid_rusage(pid, 4, ctypes.byref(r)) == 0:
150 print(pid, r.f16, r.f17, -1)
151`
152// Fields after the uuid: 16 diskio_bytesread, 17 diskio_byteswritten, and in
153// rusage_info_v6 (macOS 13+) 40 energy_nj. v4's billed_energy reads 0 on Apple
154// silicon, so before v6 the energy column is -1, unknown.
155
156export const ioProbe = (pids: readonly number[]) => ({
157 argv: ['/bin/sh', '-c', 'xcode-select -p >/dev/null 2>&1 && /usr/bin/python3 -I -c "$PY" "$@"; times', 'sh', ...pids.map(String)],
158 env: { PY: RUSAGE_PY },
159})
160
161// One nettop sample takes about 5 s, so it runs beside the 2 s sampler, not in it
162export const NET_PROBE = ['/bin/sh', '-c', '/usr/bin/nettop -P -L 1 -x -J bytes_in,bytes_out; times'] as const
163
164// The battery's full charge in watt-hours, to put a prompt's energy in battery terms
165export const BATTERY_PROBE = ['/usr/sbin/ioreg', '-rn', 'AppleSmartBattery'] as const
166
167/**
168 * Full-charge capacity in Wh from ioreg, or null on a Mac without a battery.
169 * Capacity is in mAh in the nested battery data (NominalChargeCapacity, else
170 * AppleRawMaxCapacity); the top-level MaxCapacity is a percentage, never used.
171 */
172export function parseBattery(stdout: string): number | null {
173 const field = (k: string) => new RegExp(`"${k}"\\s*=\\s*(\\d+)`).exec(stdout)?.[1]
174 const mah = field('NominalChargeCapacity') ?? field('AppleRawMaxCapacity')
175 const mv = field('Voltage')
176 if (!mah || !mv) return null
177 return (Number(mah) * Number(mv)) / 1e6
178}
179
180/** "340 J", "1.2 kJ" */
181export const joules = (j: number) => (j >= 1000 ? `${(j / 1000).toFixed(1)} kJ` : `${j.toFixed(0)} J`)
182
183export type Counters = Map<number, number[]>
184
185/** "pid read written energyNj" lines: cumulative disk bytes and energy (-1 when unknown). */
186export function parseRusage(stdout: string): Counters {
187 const out: Counters = new Map()
188 for (const line of stdout.trim().split('\n')) {
189 const [pid, ...rest] = line.trim().split(/\s+/).map(Number)
190 if (pid && rest.length === 3) out.set(pid, rest)
191 }
192 return out
193}
194
195/** nettop's "name.pid,bytes_in,bytes_out," lines: cumulative bytes per process. */
196export function parseNettop(stdout: string): Counters {
197 const out: Counters = new Map()
198 for (const line of stdout.split('\n')) {
199 const m = /\.(\d+),(\d+),(\d+),$/.exec(line.trim())
200 if (m) out.set(Number(m[1]), [Number(m[2]), Number(m[3])])
201 }
202 return out
203}
204
205/**
206 * Per-second rates between two counter samples, over the pids in `pids` that
207 * both samples hold (a process that started or ended in between is skipped,
208 * as is a counter that went backwards). Returns the summed rates and each pid's.
209 */
210export function rates(prev: Counters, cur: Counters, seconds: number, pids: Iterable<number>) {
211 const perPid = new Map<number, number[]>()
212 let total: number[] = []
213 for (const pid of pids) {
214 const a = prev.get(pid)
215 const b = cur.get(pid)
216 if (!a || !b || seconds <= 0) continue
217 const r = b.map((v, i) => Math.max(0, v - (a[i] ?? v)) / seconds)
218 perPid.set(pid, r)
219 total = r.map((v, i) => v + (total[i] ?? 0))
220 }
221 return { total, perPid }
222}
223
224export function bytes(n: number): string {
225 const units = ['B', 'KB', 'MB', 'GB']
226 let i = 0
227 while (n >= 1000 && i < units.length - 1) {
228 n /= 1024
229 i++
230 }
231 return `${n >= 100 || i === 0 ? n.toFixed(0) : n.toFixed(1)} ${units[i]}`
232}
233
234// The lite probe: no command names (half the CPU of the full ps), so the tree
235// hangs off a session root the last full probe found.
236export const SLIM_PROBE = ['/bin/sh', '-c', 'ps -axo pid=,ppid=,pcpu=,rss=; times'] as const
237
238/** CPU and RSS of the tree under `rootPid` from the lite probe; null when the root is gone. */
239export function parseSlim(stdout: string, rootPid: number): { cpu: number; rssKb: number; pids: number[] } | null {
240 const rows = new Map<number, number[]>()
241 const kids = new Map<number, number[]>()
242 for (const line of stdout.split('\n')) {
243 const m = /^\s*(\d+)\s+(\d+)\s+([\d.]+)\s+(\d+)\s*$/.exec(line)
244 if (!m) continue
245 const [pid, ppid, cpu, rss] = [Number(m[1]), Number(m[2]), Number(m[3]), Number(m[4])]
246 rows.set(pid, [cpu, rss])
247 kids.set(ppid, [...(kids.get(ppid) ?? []), pid])
248 }
249 if (!rows.has(rootPid)) return null
250 const pids: number[] = []
251 const stack = [rootPid]
252 while (stack.length) {
253 const pid = stack.pop()!
254 pids.push(pid)
255 stack.push(...(kids.get(pid) ?? []))
256 }
257 // Without names the probe's own sh and ps can't be told apart and are counted;
258 // they read ~0% CPU (just started) and ~2 MB, too little to matter on the bar
259 return {
260 cpu: pids.reduce((s, p) => s + (rows.get(p)?.[0] ?? 0), 0),
261 rssKb: pids.reduce((s, p) => s + (rows.get(p)?.[1] ?? 0), 0),
262 pids,
263 }
264}
265
266// Whether the Mac runs on battery: checked about once a minute (~9 ms of CPU)
267export const POWER_SOURCE_PROBE = ['/usr/bin/pmset', '-g', 'batt'] as const
268
269/** On battery or AC from `pmset -g batt`; null on a Mac that doesn't say (no battery). */
270export function parsePowerSource(stdout: string): boolean | null {
271 if (stdout.includes("'Battery Power'")) return true
272 if (stdout.includes("'AC Power'") || stdout.includes("'UPS Power'")) return false
273 return null
274}
275
276/** "0.42 W", "12 W" */
277export const watts = (w: number) => `${w >= 10 ? w.toFixed(0) : w.toFixed(2)} W`
278types/index.d.ts 95 lines1export type Proc = {
2 pid: number
3 ppid: number
4 depth: number
5 cpu: number
6 rssKb: number
7 elapsed: string
8 name: string
9 /** Average power over the last sample, in watts; null until two samples */
10 watts: number | null
11}
12
13/** Every Claude process tree on the machine, this session's included */
14export type AllClaude = { trees: number; cpu: number; rssKb: number; pids: number[] }
15
16export type Snapshot = {
17 rootPid: number
18 rootName: string
19 allClaude: AllClaude
20 cores: number
21 memBytes: number
22 load: number[]
23 cpu: number
24 rssKb: number
25 procs: Proc[]
26}
27
28/** Rates over the last sample, per second, for the whole tree */
29export type Io = {
30 /** Disk bytes read and written per second, and watts; null without rusage */
31 diskRead: number
32 diskWrite: number
33 watts: number
34 /** False before macOS 13, where per-process energy is not reported */
35 hasEnergy: boolean
36 /** Energy since the pane or bar started sampling, in joules */
37 joules: number
38}
39
40export type Net = { bytesIn: number; bytesOut: number }
41
42/** One prompt, from its submit to its turn's end */
43export type Turn = {
44 /** Clock time it started, in ms */
45 startedAt: number
46 seconds: number
47 /** Energy the session's tree used, in joules */
48 joules: number
49 /** CPU time the session's tree used, in seconds */
50 cpuSeconds: number
51 /** Highest CPU % sampled during it (100 = one core) */
52 peakCpu: number
53}
54
55export type Stats = {
56 snapshot: Snapshot | null
57 error: string | null
58 cpuHistory: number[]
59 ramHistory: number[]
60 /** null until two rusage samples; also null where rusage is unavailable */
61 io: Io | null
62 isRusageAvailable: boolean
63 /** null until two nettop samples */
64 net: Net | null
65 netHistory: number[]
66 diskHistory: number[]
67 energyHistory: number[]
68 /** Power of every Claude tree on the machine, in watts; null until two samples */
69 allWatts: number | null
70 /** Running totals for the session's tree since sampling began */
71 cpuSeconds: number
72 /** The prompt running now (its totals so far) and the last one that finished */
73 turn: Turn | null
74 lastTurn: Turn | null
75 /** Full battery in Wh; null on a Mac without one */
76 batteryWh: number | null
77 /** CPU seconds the monitor's own probes used, and since when (clock ms) */
78 ownCpuSeconds: number
79 ownSince: number | null
80 /** Whether the Mac is on battery; null until checked, or on a Mac without one */
81 isOnBattery: boolean | null
82 /** The session tree's energy while on battery since the last unplug (J), and since when (clock ms) */
83 batteryJoules: number
84 batterySince: number | null
85}
86
87/** How much the monitor itself may cost: lite every 10 s, normal 5 s, full 2 s */
88export type Mode = 'lite' | 'normal' | 'full'
89
90declare module 'claude-code' {
91 interface PluginState {
92 'session-stats': { stats: Stats; isBarOn: boolean; mode: Mode; isBarPromptOn: boolean }
93 }
94}
95