session-stats
/session-stats opens a live pane with CPU, RAM and the process tree of this Claude session
newpanebandcommandprocesstimer

/session-stats opens a live pane with CPU, RAM and the process tree of this Claude session
A Claude Code mod that shows what your current session is costing your machine. Type /session-stats and a pane opens with:
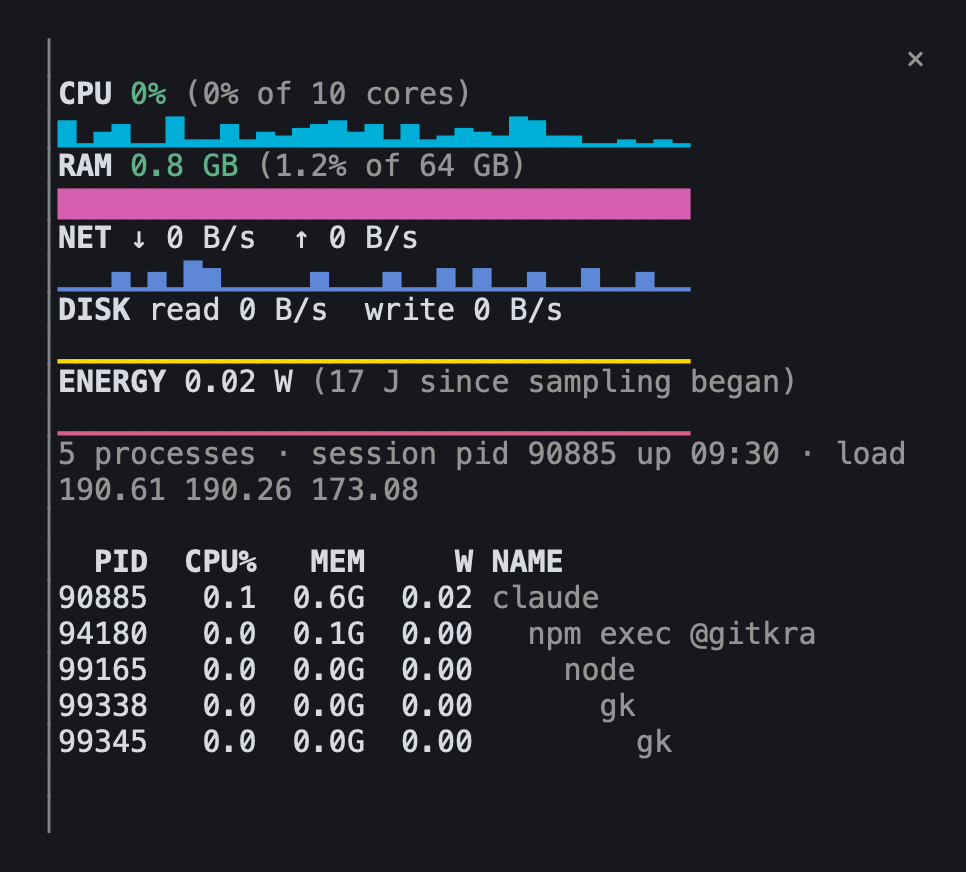
claude process plus every shell, build, test runner and stdio MCP server it started), with sparklines of up to the last 4 minutesIt samples every 2 seconds while the pane or the bar is showing, and stops when neither is.
/session-stats bar toggles a one-line strip above the prompt:

Each history is up to 30 cells wide (one minute) from the start and fills left to right, then scrolls. Click the strip to open the full pane. The setting is remembered across sessions; /session-stats bar on and /session-stats bar off set it directly.
/session-stats stop (or off, or kill) closes the pane, turns the bar off and stops all sampling, so the mod runs nothing until you call it again.
At the prompt of a Claude Code terminal session:
/plugin install session-stats --marketplace toml0006/claude-session-statsAnswer y to add the marketplace, then pick a scope. From a shell:
claude plugin install session-stats --marketplace toml0006/claude-session-statssysctl hw.memsize and vm.loadavg and macOS ps output.claude process, so they're part of its numbers, not separate rows.ps's smoothed recent average and can pass 100% on multiple cores.nettop, which takes about 5 seconds per sample, so it updates about every 5 seconds. A background session (claude --bg) sends its API traffic through the shared daemon, so that traffic isn't counted under the session.proc_pid_rusage (what Activity Monitor reads), called through the system python3. They need the Xcode Command Line Tools; without them the pane says so rather than triggering an install prompt. Energy needs macOS 13 or later.claude plugin validate .
claude plugin test .
claude --plugin-dir .MIT
hooks/register.tsx 270 lines1import { atom, read, update } from 'claude-code'
2import type { EngineInterface, Register, Timer } from 'claude-code'
3
4import type { Io, Stats } from '../types'
5import type { Counters } from './stats'
6import { NET_PROBE, PROBE, bytes, gb, ioProbe, parseNettop, parseProbe, parseRusage, rates, sparkline } from './stats'
7
8const PANE = 'session-stats'
9const PERIOD_MS = 2000
10const HISTORY = 120
11// Each history in the bar is at most this many cells (one minute of samples)
12const BAR_SPAN = 30
13const BAR_KEY = 'bar'
14const EMPTY: Stats = {
15 snapshot: null,
16 error: null,
17 cpuHistory: [],
18 ramHistory: [],
19 io: null,
20 isRusageAvailable: true,
21 net: null,
22 netHistory: [],
23 diskHistory: [],
24 energyHistory: [],
25}
26const stats = atom({ plugin: 'session-stats', key: 'stats' } as const, EMPTY)
27const isBarOn = atom({ plugin: 'session-stats', key: 'isBarOn' } as const, false)
28
29const cpuColor = (cpu: number) => (cpu >= 100 ? 'red' : cpu >= 50 ? 'yellow' : 'green')
30const ramColor = (kb: number) => (kb >= 4194304 ? 'red' : kb >= 2097152 ? 'yellow' : 'green')
31
32// One sampler serves both the bar and the pane, and runs only while either
33// is showing. A reload resets these; session.start restarts it for the bar.
34let timer: Timer | undefined
35let isPaneOpen = false
36
37// The previous cumulative counters, to turn the next ones into rates
38let prevRusage: { at: number; counters: Counters } | undefined
39let prevNet: { at: number; counters: Counters } | undefined
40let isNetBusy = false
41
42const push = (list: readonly number[], v: number) => [...list, v].slice(-HISTORY)
43
44// The host keeps $.state across reloads and updates, so a value written by an
45// older version can lack fields this one reads: fill them in on every read.
46async function readStats($: EngineInterface): Promise<Stats> {
47 return { ...EMPTY, ...(await read($, stats)) }
48}
49
50async function updateStats($: EngineInterface, fn: (s: Stats) => Stats) {
51 await update($, stats, s => fn({ ...EMPTY, ...s }))
52}
53
54async function sample($: EngineInterface) {
55 try {
56 const { stdout } = await $.process.run(PROBE, { env: { LC_ALL: 'C' }, timeoutMs: 5000 })
57 const snap = parseProbe(stdout)
58 const pids = snap.procs.map(p => p.pid)
59
60 const probe = ioProbe(pids)
61 const usage = parseRusage((await $.process.run(probe.argv, { env: probe.env, timeoutMs: 5000 })).stdout)
62 const at = await $.clock.now()
63 let io: Io | null = null
64 let seconds = 0
65 if (prevRusage && usage.size > 0) {
66 seconds = (at - prevRusage.at) / 1000
67 const { total, perPid } = rates(prevRusage.counters, usage, seconds, pids)
68 const hasEnergy = [...usage.values()].every(c => (c[2] ?? -1) >= 0)
69 for (const p of snap.procs) {
70 const r = perPid.get(p.pid)
71 p.watts = r && hasEnergy ? (r[2] ?? 0) / 1e9 : null
72 }
73 const watts = hasEnergy ? (total[2] ?? 0) / 1e9 : 0
74 io = { diskRead: total[0] ?? 0, diskWrite: total[1] ?? 0, watts, hasEnergy, joules: 0 }
75 }
76 prevRusage = usage.size > 0 ? { at, counters: usage } : undefined
77
78 await updateStats($, s => ({
79 ...s,
80 snapshot: snap,
81 error: null,
82 cpuHistory: push(s.cpuHistory, snap.cpu),
83 ramHistory: push(s.ramHistory, snap.rssKb),
84 isRusageAvailable: usage.size > 0,
85 io: io ? { ...io, joules: (s.io?.joules ?? 0) + io.watts * seconds } : s.io,
86 diskHistory: io ? push(s.diskHistory, io.diskRead + io.diskWrite) : s.diskHistory,
87 energyHistory: io?.hasEnergy ? push(s.energyHistory, io.watts) : s.energyHistory,
88 }))
89 if (!isNetBusy) void sampleNet($, pids)
90 } catch (err) {
91 await updateStats($, s => ({ ...s, error: String(err) }))
92 }
93}
94
95async function sampleNet($: EngineInterface, pids: readonly number[]) {
96 isNetBusy = true
97 try {
98 const counters = parseNettop((await $.process.run(NET_PROBE, { timeoutMs: 15000 })).stdout)
99 const at = await $.clock.now()
100 if (prevNet) {
101 const { total } = rates(prevNet.counters, counters, (at - prevNet.at) / 1000, pids)
102 const net = { bytesIn: total[0] ?? 0, bytesOut: total[1] ?? 0 }
103 await updateStats($, s => ({ ...s, net, netHistory: push(s.netHistory, net.bytesIn + net.bytesOut) }))
104 }
105 prevNet = { at, counters }
106 } catch {
107 // Network is a nice-to-have: a failed nettop leaves the last reading
108 } finally {
109 isNetBusy = false
110 }
111}
112
113async function syncSampler($: EngineInterface) {
114 const isNeeded = isPaneOpen || (await read($, isBarOn))
115 if (isNeeded && !timer) {
116 await sample($)
117 timer = $.clock.every(PERIOD_MS, () => void sample($))
118 } else if (!isNeeded && timer) {
119 timer.cancel()
120 timer = undefined
121 }
122}
123
124// Closes the pane, turns the bar off (remembered), and stops every sampler
125async function stopAll($: EngineInterface) {
126 isPaneOpen = false
127 await $.store.set(BAR_KEY, false)
128 await update($, isBarOn, () => false)
129 await syncSampler($)
130 prevRusage = undefined
131 prevNet = undefined
132 await $.ui.close({ id: PANE }).catch(() => undefined)
133 return 'Session stats stopped: pane closed, bar off, nothing sampling. /session-stats starts it again.'
134}
135
136async function openPane($: EngineInterface) {
137 const opened = await $.ui.open({ id: PANE, title: 'Session stats' })
138 if (!opened.isPlaced) return `Session stats pane not shown: ${opened.reason}`
139 isPaneOpen = true
140 await syncSampler($)
141 return 'Session stats pane opened.'
142}
143
144export const register: Register = on => {
145 on('session.start', async ($, e, next) => {
146 await $.command.register({
147 name: 'session-stats',
148 description: 'Show live CPU, RAM and processes of this session; "bar" toggles the strip above the prompt, "stop" shuts everything off',
149 argumentHint: '[bar [on|off] | stop]',
150 })
151 const isOn = (await $.store.get(BAR_KEY)) === true
152 await update($, isBarOn, () => isOn)
153 // A reload keeps an open pane open but forgets it here; ask, so it keeps updating
154 isPaneOpen = await $.ui
155 .panes()
156 .then(panes => panes.some(pane => pane.id === PANE))
157 .catch(() => false)
158 await syncSampler($)
159 return next(e)
160 })
161
162 on('command.run', { command: 'session-stats' }, async ($, e) => {
163 const [sub, arg] = e.args.trim().split(/\s+/)
164 if (sub === 'stop' || sub === 'off' || sub === 'kill') return { text: await stopAll($) }
165 if (sub !== 'bar') return { text: await openPane($) }
166
167 const isOn = arg === 'on' ? true : arg === 'off' ? false : !(await read($, isBarOn))
168 await $.store.set(BAR_KEY, isOn)
169 await update($, isBarOn, () => isOn)
170 await syncSampler($)
171 return { text: `Session stats bar ${isOn ? 'on' : 'off'}.` }
172 })
173
174 on('ui.close', { id: PANE }, async ($, e, next) => {
175 isPaneOpen = false
176 await syncSampler($)
177 return next(e)
178 })
179
180 // The strip above the prompt: numbers first, then each history at its full
181 // width from the first sample, filling left to right and then scrolling. One
182 // Button, so a click anywhere on it opens the pane.
183 on('ui.render', { component: 'AbovePrompt' }, async ($, e, next) => {
184 if (e.props.hasSurvey || !(await read($, isBarOn))) return next(e)
185
186 const { Button, Text } = $.ui.resolve(e)
187 const { snapshot: s, cpuHistory, ramHistory } = await readStats($)
188 const width = e.props.bodyColumns ?? e.viewport?.columns ?? 80
189 // "⚙ CPU 100% " + " " + " RAM 10.0G " + " " is 26 cells around the two histories
190 const span = Math.max(6, Math.min(BAR_SPAN, Math.floor((width - 26) / 2)))
191 const cpu = sparkline(cpuHistory.slice(-span))
192 const ram = sparkline(ramHistory.slice(-span))
193
194 return (
195 <Button key="open-pane" plain onPress={() => void openPane($)}>
196 <Text dimColor>⚙ CPU </Text>
197 <Text color={cpuColor(s?.cpu ?? 0)}>{(s ? `${s.cpu.toFixed(0)}%` : '…').padStart(4)} </Text>
198 <Text color="cyan">{cpu}</Text>
199 <Text dimColor>{'·'.repeat(span - cpu.length)} RAM </Text>
200 <Text color={ramColor(s?.rssKb ?? 0)}>{(s ? `${gb(s.rssKb)}G` : '…').padStart(5)} </Text>
201 <Text color="magenta">{ram}</Text>
202 <Text dimColor>{'·'.repeat(span - ram.length)}</Text>
203 </Button>
204 )
205 })
206
207 on('ui.render', { component: 'Pane', requestId: PANE }, async ($, e) => {
208 const { Box, Text } = $.ui.resolve(e)
209 const { snapshot: s, error, cpuHistory, ramHistory, io, net, netHistory, diskHistory, energyHistory, isRusageAvailable } =
210 await readStats($)
211 const width = e.props.bodyColumns ?? e.viewport?.columns ?? 80
212 const noRusage = isRusageAvailable ? null : 'needs the Xcode Command Line Tools'
213
214 if (!s) return <Text dimColor>{error ?? 'Sampling…'}</Text>
215
216 const machinePct = (s.cpu / s.cores).toFixed(0)
217 const ramPct = ((s.rssKb * 1024 * 100) / s.memBytes).toFixed(1)
218 const spark = Math.max(10, Math.min(HISTORY, width - 14))
219 const room = Math.max(3, (e.viewport?.rows ?? 30) - 18)
220 const nameCols = Math.max(10, width - 31)
221 const pad = (v: string, n: number) => v.padStart(n)
222
223 return (
224 <Box flexDirection="column">
225 <Text>
226 <Text bold>CPU </Text>
227 <Text color={cpuColor(s.cpu)}>{s.cpu.toFixed(0)}%</Text>
228 <Text dimColor> ({machinePct}% of {s.cores} cores)</Text>
229 </Text>
230 <Text color="cyan">{sparkline(cpuHistory.slice(-spark))}</Text>
231 <Text>
232 <Text bold>RAM </Text>
233 <Text color={ramColor(s.rssKb)}>{gb(s.rssKb)} GB</Text>
234 <Text dimColor> ({ramPct}% of {gb(s.memBytes / 1024)} GB)</Text>
235 </Text>
236 <Text color="magenta">{sparkline(ramHistory.slice(-spark))}</Text>
237 <Text>
238 <Text bold>NET </Text>
239 {net ? `↓ ${bytes(net.bytesIn)}/s ↑ ${bytes(net.bytesOut)}/s` : <Text dimColor>measuring…</Text>}
240 </Text>
241 <Text color="blue">{sparkline(netHistory.slice(-spark))}</Text>
242 <Text>
243 <Text bold>DISK </Text>
244 {io ? `read ${bytes(io.diskRead)}/s write ${bytes(io.diskWrite)}/s` : <Text dimColor>{noRusage ?? 'measuring…'}</Text>}
245 </Text>
246 <Text color="yellow">{sparkline(diskHistory.slice(-spark))}</Text>
247 <Text>
248 <Text bold>ENERGY </Text>
249 {io?.hasEnergy ? `${io.watts.toFixed(2)} W` : <Text dimColor>{io ? 'needs macOS 13 or later' : noRusage ?? 'measuring…'}</Text>}
250 {io?.hasEnergy && <Text dimColor> ({io.joules.toFixed(0)} J since sampling began)</Text>}
251 </Text>
252 <Text color="red">{sparkline(energyHistory.slice(-spark))}</Text>
253 <Text dimColor>
254 {s.procs.length} processes · session pid {s.rootPid} up {s.procs[0]?.elapsed} · load {s.load.map(l => l.toFixed(2)).join(' ')}
255 </Text>
256 <Text> </Text>
257 <Text bold>{' PID CPU% MEM W NAME'}</Text>
258 {s.procs.slice(0, room).map(p => (
259 <Text>
260 {pad(String(p.pid), 5)} {pad(p.cpu.toFixed(1), 5)} {pad(gb(p.rssKb) + 'G', 5)} {pad(p.watts == null ? '–' : p.watts.toFixed(2), 5)}{' '}
261 <Text dimColor={p.cpu < 1}>{(' '.repeat(p.depth) + p.name).slice(0, nameCols)}</Text>
262 </Text>
263 ))}
264 {s.procs.length > room && <Text dimColor>…{s.procs.length - room} more</Text>}
265 {error && <Text color="red">last sample failed: {error}</Text>}
266 </Box>
267 )
268 })
269}
270hooks/stats.ts 172 lines1import type { Proc, Snapshot } from '../types'
2
3// One shell call gathers everything: the spawner's pid (the engine, or a child
4// of it), machine facts, then every process. LC_ALL=C keeps ps's decimals dots.
5export const PROBE = [
6 '/bin/sh',
7 '-c',
8 'echo $PPID; sysctl -n hw.ncpu hw.memsize vm.loadavg; ps -axo pid=,ppid=,pcpu=,rss=,etime=,comm=',
9] as const
10
11const ROW = /^\s*(\d+)\s+(\d+)\s+([\d.]+)\s+(\d+)\s+(\S+)\s+(.*)$/
12
13// "claude bg-spare" and "/Users/x/.local/bin/claude" both name a claude process
14const isClaude = (name: string) => name.split(' ')[0]?.split('/').pop() === 'claude'
15
16// A full path may hold spaces ("Application Support"); a renamed title holds words
17const shortName = (name: string) => {
18 if (name.startsWith('/')) return name.split('/').pop() ?? name
19 const [head = '', ...rest] = name.split(' ')
20 return [head.split('/').pop(), ...rest].join(' ')
21}
22
23export function parseProbe(stdout: string): Snapshot {
24 const [spawner = '', ncpu, memsize, loadavg = '', ...rows] = stdout.trim().split('\n')
25
26 const all = new Map<number, Omit<Proc, 'depth' | 'watts'>>()
27 for (const row of rows) {
28 const m = ROW.exec(row)
29 if (!m) continue
30 const pid = Number(m[1])
31 all.set(pid, {
32 pid,
33 ppid: Number(m[2]),
34 cpu: Number(m[3]),
35 rssKb: Number(m[4]),
36 elapsed: m[5] ?? '',
37 name: (m[6] ?? '').trim(),
38 })
39 }
40
41 // The session is the nearest claude ancestor of whatever ran the probe
42 let rootPid = Number(spawner)
43 while (rootPid > 1 && !isClaude(all.get(rootPid)?.name ?? '')) {
44 rootPid = all.get(rootPid)?.ppid ?? 1
45 }
46 if (rootPid <= 1) throw new Error(`no claude process above pid ${spawner}`)
47
48 const children = new Map<number, Omit<Proc, 'depth' | 'watts'>[]>()
49 for (const p of all.values()) {
50 if (!children.has(p.ppid)) children.set(p.ppid, [])
51 children.get(p.ppid)!.push(p)
52 }
53
54 // Depth-first so the table reads as a tree; busiest siblings first. The probe's
55 // own sh and ps are left out, since they exist only because we asked.
56 const probePids = new Set<number>()
57 for (const sh of children.get(Number(spawner)) ?? []) {
58 const ps = (children.get(sh.pid) ?? []).find(c => shortName(c.name) === 'ps')
59 if (shortName(sh.name) === 'sh' && ps) probePids.add(sh.pid).add(ps.pid)
60 }
61 const procs: Proc[] = []
62 // The io probes (nettop, and python under sh) are the session's direct children
63 const isIoProbe = (p: Omit<Proc, 'depth' | 'watts'>, depth: number) =>
64 depth === 1 && ['nettop', 'Python', 'python3'].includes(shortName(p.name))
65 const walk = (p: Omit<Proc, 'depth' | 'watts'>, depth: number) => {
66 if (probePids.has(p.pid) || isIoProbe(p, depth)) return
67 procs.push({ ...p, depth, name: shortName(p.name), watts: null })
68 const kids = [...(children.get(p.pid) ?? [])].sort((a, b) => b.cpu - a.cpu || b.rssKb - a.rssKb)
69 for (const k of kids) walk(k, depth + 1)
70 }
71 walk(all.get(rootPid)!, 0)
72
73 return {
74 rootPid,
75 rootName: shortName(all.get(rootPid)!.name),
76 cores: Number(ncpu),
77 memBytes: Number(memsize),
78 load: loadavg.replace(/[{}]/g, '').trim().split(/\s+/).map(Number),
79 cpu: procs.reduce((s, p) => s + p.cpu, 0),
80 rssKb: procs.reduce((s, p) => s + p.rssKb, 0),
81 procs,
82 }
83}
84
85const BARS = '▁▂▃▄▅▆▇█'
86
87export function sparkline(values: readonly number[], max?: number): string {
88 const top = max ?? Math.max(1, ...values)
89 return values.map(v => BARS[Math.min(7, Math.max(0, Math.round((v / top) * 7)))]).join('')
90}
91
92export const gb = (kb: number) => (kb / 1048576).toFixed(kb >= 10485760 ? 0 : 1)
93
94// Disk and energy per process come from proc_pid_rusage (what Activity Monitor
95// reads), called through the system python. It runs only where the Command
96// Line Tools are installed, so a bare Mac never sees an install prompt; there
97// the probe prints nothing and the pane says why.
98const RUSAGE_PY = `
99import ctypes, sys
100lib = ctypes.CDLL('/usr/lib/libproc.dylib')
101class RU(ctypes.Structure):
102 _fields_ = [('uuid', ctypes.c_uint8 * 16)] + [('f%d' % i, ctypes.c_uint64) for i in range(56)]
103for pid in map(int, sys.argv[1:]):
104 r = RU()
105 if lib.proc_pid_rusage(pid, 6, ctypes.byref(r)) == 0:
106 print(pid, r.f16, r.f17, r.f40)
107 elif lib.proc_pid_rusage(pid, 4, ctypes.byref(r)) == 0:
108 print(pid, r.f16, r.f17, -1)
109`
110// Fields after the uuid: 16 diskio_bytesread, 17 diskio_byteswritten, and in
111// rusage_info_v6 (macOS 13+) 40 energy_nj. v4's billed_energy reads 0 on Apple
112// silicon, so before v6 the energy column is -1, unknown.
113
114export const ioProbe = (pids: readonly number[]) => ({
115 argv: ['/bin/sh', '-c', 'xcode-select -p >/dev/null 2>&1 && exec /usr/bin/python3 -I -c "$PY" "$@"', 'sh', ...pids.map(String)],
116 env: { PY: RUSAGE_PY },
117})
118
119// One nettop sample takes about 5 s, so it runs beside the 2 s sampler, not in it
120export const NET_PROBE = ['/usr/bin/nettop', '-P', '-L', '1', '-x', '-J', 'bytes_in,bytes_out'] as const
121
122export type Counters = Map<number, number[]>
123
124/** "pid read written energyNj" lines: cumulative disk bytes and energy (-1 when unknown). */
125export function parseRusage(stdout: string): Counters {
126 const out: Counters = new Map()
127 for (const line of stdout.trim().split('\n')) {
128 const [pid, ...rest] = line.trim().split(/\s+/).map(Number)
129 if (pid && rest.length === 3) out.set(pid, rest)
130 }
131 return out
132}
133
134/** nettop's "name.pid,bytes_in,bytes_out," lines: cumulative bytes per process. */
135export function parseNettop(stdout: string): Counters {
136 const out: Counters = new Map()
137 for (const line of stdout.split('\n')) {
138 const m = /\.(\d+),(\d+),(\d+),$/.exec(line.trim())
139 if (m) out.set(Number(m[1]), [Number(m[2]), Number(m[3])])
140 }
141 return out
142}
143
144/**
145 * Per-second rates between two counter samples, over the pids in `pids` that
146 * both samples hold (a process that started or ended in between is skipped,
147 * as is a counter that went backwards). Returns the summed rates and each pid's.
148 */
149export function rates(prev: Counters, cur: Counters, seconds: number, pids: Iterable<number>) {
150 const perPid = new Map<number, number[]>()
151 let total: number[] = []
152 for (const pid of pids) {
153 const a = prev.get(pid)
154 const b = cur.get(pid)
155 if (!a || !b || seconds <= 0) continue
156 const r = b.map((v, i) => Math.max(0, v - (a[i] ?? v)) / seconds)
157 perPid.set(pid, r)
158 total = r.map((v, i) => v + (total[i] ?? 0))
159 }
160 return { total, perPid }
161}
162
163export function bytes(n: number): string {
164 const units = ['B', 'KB', 'MB', 'GB']
165 let i = 0
166 while (n >= 1000 && i < units.length - 1) {
167 n /= 1024
168 i++
169 }
170 return `${n >= 100 || i === 0 ? n.toFixed(0) : n.toFixed(1)} ${units[i]}`
171}
172types/index.d.ts 58 lines1export type Proc = {
2 pid: number
3 ppid: number
4 depth: number
5 cpu: number
6 rssKb: number
7 elapsed: string
8 name: string
9 /** Average power over the last sample, in watts; null until two samples */
10 watts: number | null
11}
12
13export type Snapshot = {
14 rootPid: number
15 rootName: string
16 cores: number
17 memBytes: number
18 load: number[]
19 cpu: number
20 rssKb: number
21 procs: Proc[]
22}
23
24/** Rates over the last sample, per second, for the whole tree */
25export type Io = {
26 /** Disk bytes read and written per second, and watts; null without rusage */
27 diskRead: number
28 diskWrite: number
29 watts: number
30 /** False before macOS 13, where per-process energy is not reported */
31 hasEnergy: boolean
32 /** Energy since the pane or bar started sampling, in joules */
33 joules: number
34}
35
36export type Net = { bytesIn: number; bytesOut: number }
37
38export type Stats = {
39 snapshot: Snapshot | null
40 error: string | null
41 cpuHistory: number[]
42 ramHistory: number[]
43 /** null until two rusage samples; also null where rusage is unavailable */
44 io: Io | null
45 isRusageAvailable: boolean
46 /** null until two nettop samples */
47 net: Net | null
48 netHistory: number[]
49 diskHistory: number[]
50 energyHistory: number[]
51}
52
53declare module 'claude-code' {
54 interface PluginState {
55 'session-stats': { stats: Stats; isBarOn: boolean }
56 }
57}
58