usage-line
Shows context fill and the session and weekly limits as bars above the message box.
bandtimer

Shows context fill and the session and weekly limits as bars above the message box.
A Claude Code mod that shows three bars above the message box:
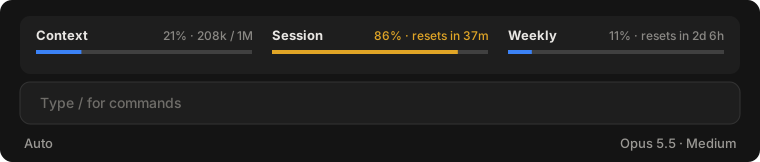
A bar turns amber from 70% and red from 90%. The terminal shows the same figures as text.
Show usage in the terminal (showInTerminal, off by default) can be turned on in /config to show the figures as text in the terminal. The desktop app shows the bars either way.
Type this at the Claude Code prompt:
/plugin install usage-line --marketplace thomthom/claude-usage-lineAnswer y to add the marketplace, then pick a scope. New sessions show the rings.
claude plugin update usage-lineclaude plugin validate .
claude plugin test .hooks/register.tsx 76 lines1import { atom, read, update } from 'claude-code'
2import type { EngineInterface, Register } from 'claude-code'
3
4import { BAR_HEIGHT, barSvg, gauges } from './format'
5
6// The band reads this only so that each new measurement redraws it.
7const measuredAt = atom({ plugin: 'usage-line', key: 'measuredAt' } as const, 0)
8
9async function remeasure($: EngineInterface): Promise<void> {
10 const now = await $.clock.now()
11 await update($, measuredAt, () => now)
12}
13
14const LEVEL_COLORS = { normal: undefined, warning: 'warning', critical: 'error' } as const
15
16export const register: Register = (on, options) => {
17 on('session.start', async ($, e, next) => {
18 const started = await next(e)
19 // Re-measuring each minute keeps the time until each limit resets current between turns.
20 $.clock.every(60_000, () => remeasure($))
21 await remeasure($)
22 return started
23 })
24
25 on('session.measure', async ($, e, next) => {
26 const measured = await next(e)
27 await remeasure($)
28 return measured
29 })
30
31 on('ui.render', { component: 'AbovePrompt' }, async ($, e, next) => {
32 await read($, measuredAt)
33 if (e.props.hasSurvey) return next(e)
34 if (e.surface === 'terminal' && options.showInTerminal !== true) return next(e)
35
36 const { context, rateLimits } = await $.session.usage()
37 const shown = gauges(context, rateLimits, await $.clock.now())
38 if (shown.length === 0) return next(e)
39
40 if (e.surface === 'terminal') {
41 const { Box, Text } = $.ui.resolve(e)
42 return (
43 <Box flexDirection="row" gap={3}>
44 {shown.map(gauge => (
45 <Text key={gauge.key} color={LEVEL_COLORS[gauge.level]}>
46 {gauge.label} {gauge.percent}% <Text dimColor>{gauge.detail}</Text>
47 </Text>
48 ))}
49 </Box>
50 )
51 }
52
53 const { Box, Text, Svg } = $.ui.resolve(e)
54 return (
55 <Box flexDirection="row" gap="lg">
56 {shown.map(gauge => (
57 <Box key={gauge.key} flexDirection="column" gap="xs" flexGrow={1} flexShrink={1}>
58 <Box flexDirection="row" justifyContent="space-between" gap="sm">
59 <Text weight="medium">{gauge.label}</Text>
60 <Text size="footnote" dimColor tabular color={LEVEL_COLORS[gauge.level]}>
61 {gauge.percent}%{gauge.detail ? ` · ${gauge.detail}` : ''}
62 </Text>
63 </Box>
64 {/* An Svg is sized in pixels. A Box's height counts text rows, which is far too tall for a bar. */}
65 <Svg
66 source={barSvg(gauge.percent, gauge.level)}
67 alt={`${gauge.label} ${gauge.percent}%`}
68 height={BAR_HEIGHT}
69 />
70 </Box>
71 ))}
72 </Box>
73 )
74 })
75}
76hooks/format.ts 88 lines1import type { SessionContextUsage, SessionRateLimit } from 'claude-code'
2
3export type Level = 'normal' | 'warning' | 'critical'
4
5export type Gauge = {
6 key: string
7 label: string
8 percent: number
9 detail: string
10 level: Level
11}
12
13const LIMIT_LABELS: Record<string, string> = {
14 five_hour: 'Session',
15 seven_day: 'Weekly',
16}
17
18export function formatTimeLeft(resetsAt: string, now: number): string {
19 const minutes = Math.max(0, Math.round((Date.parse(resetsAt) - now) / 60_000))
20 const days = Math.floor(minutes / 1440)
21 const hours = Math.floor((minutes % 1440) / 60)
22 if (days > 0) return `${days}d ${hours}h`
23 if (hours > 0) return `${hours}h ${minutes % 60}m`
24 return `${minutes}m`
25}
26
27export function formatTokens(tokens: number): string {
28 if (tokens >= 1_000_000) return `${Number((tokens / 1_000_000).toFixed(1))}M`
29 if (tokens >= 1_000) return `${Math.round(tokens / 1_000)}k`
30 return `${tokens}`
31}
32
33export function levelOf(percent: number): Level {
34 if (percent >= 90) return 'critical'
35 if (percent >= 70) return 'warning'
36 return 'normal'
37}
38
39export function gauges(
40 context: SessionContextUsage,
41 rateLimits: SessionRateLimit[],
42 now: number,
43): Gauge[] {
44 const result: Gauge[] = []
45 if (context.percent !== undefined) {
46 result.push({
47 key: 'context',
48 label: 'Context',
49 percent: context.percent,
50 detail: `${formatTokens(context.tokens ?? 0)} / ${formatTokens(context.window)}`,
51 level: levelOf(context.percent),
52 })
53 }
54 for (const limit of rateLimits) {
55 const percent = Math.round(limit.percentUsed)
56 result.push({
57 key: limit.kind,
58 label: LIMIT_LABELS[limit.kind] ?? limit.kind,
59 percent,
60 detail: limit.resetsAt ? `resets in ${formatTimeLeft(limit.resetsAt, now)}` : '',
61 level: levelOf(percent),
62 })
63 }
64 return result
65}
66
67const BAR_COLORS: Record<Level, string> = {
68 normal: '#3b82f6',
69 warning: '#e0a526',
70 critical: '#e5534b',
71}
72
73export const BAR_HEIGHT = 4
74
75// The viewBox is 100 units wide so the filled width is the percentage itself, and
76// preserveAspectRatio="none" stretches it to whatever width the column has.
77// The track is grey at partial opacity so it reads on light and dark themes.
78export function barSvg(percent: number, level: Level): string {
79 const filled = Math.min(100, Math.max(0, percent))
80 return (
81 `<svg xmlns="http://www.w3.org/2000/svg" width="100%" height="${BAR_HEIGHT}" ` +
82 `viewBox="0 0 100 ${BAR_HEIGHT}" preserveAspectRatio="none">` +
83 `<rect width="100" height="${BAR_HEIGHT}" fill="#808080" fill-opacity="0.35"/>` +
84 `<rect width="${filled}" height="${BAR_HEIGHT}" fill="${BAR_COLORS[level]}"/>` +
85 '</svg>'
86 )
87}
88types/index.d.ts 9 lines1// Milliseconds since the epoch, from $.clock.now().
2export type Timestamp = number
3
4declare module 'claude-code' {
5 interface PluginState {
6 'usage-line': { measuredAt: Timestamp }
7 }
8}
9