Usage Panel
A /meter pane with your spend, pace, token mix, forecast, and plan week, plus /meter web: a full report that reads every Claude Code transcript on this…
newpanecommandtoastprocesstimer

A /meter pane with your spend, pace, token mix, forecast, and plan week, plus /meter web: a full report that reads every Claude Code transcript on this…
Two ways to see what your Claude Code usage costs:
/meter: a pane inside Claude Code with your spend, pace, token mix, forecast, and plan week, live as you work./meter web: a full report in your browser. It reads every Claude Code transcript on your computer, back to the oldest one Claude Code kept, and evaluates your habits: cache hits, cold restarts, context size, subagents, models, projects, the hours you work, your most expensive sessions, and the tools Claude calls most.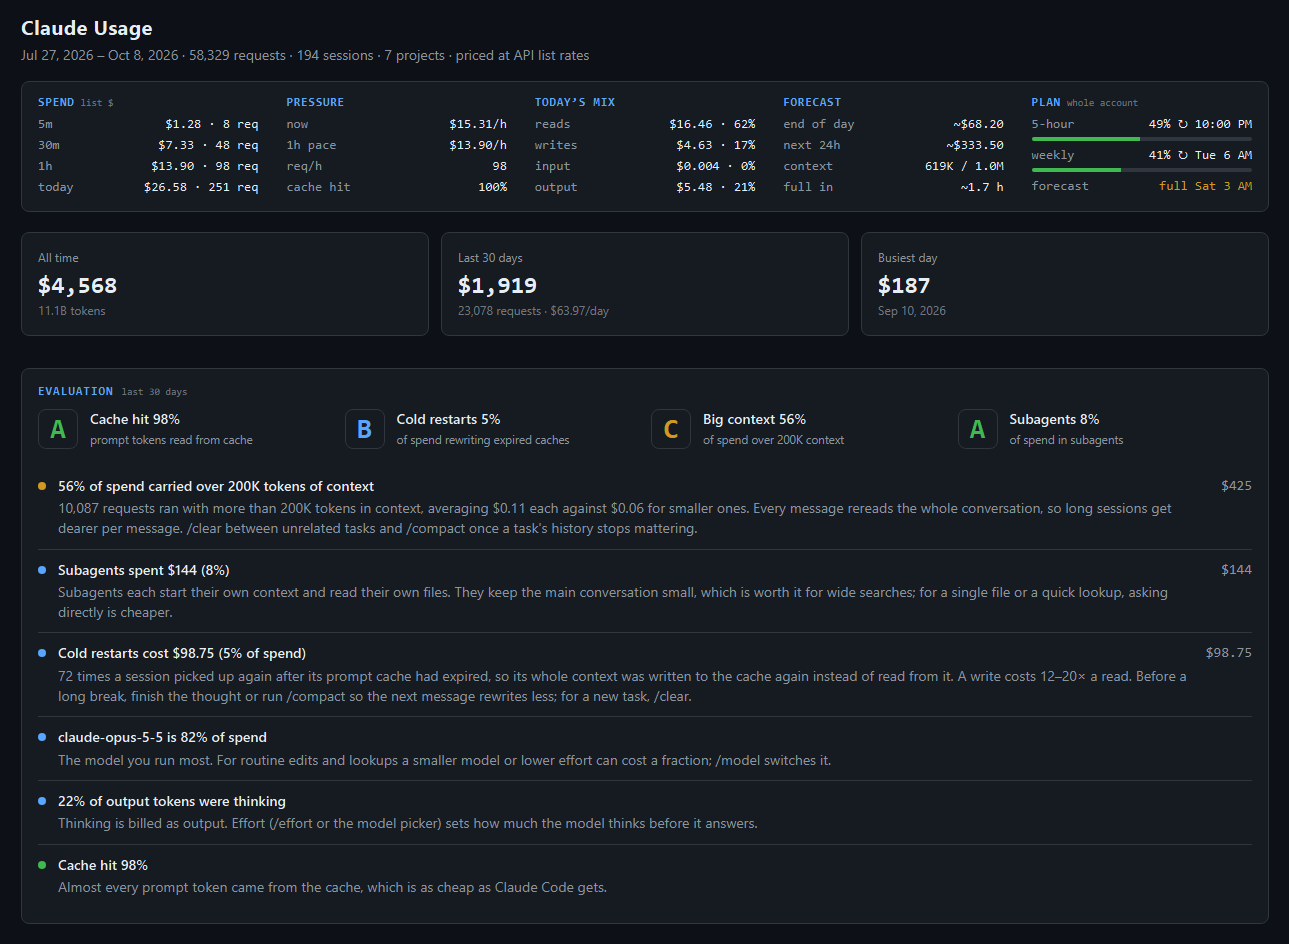
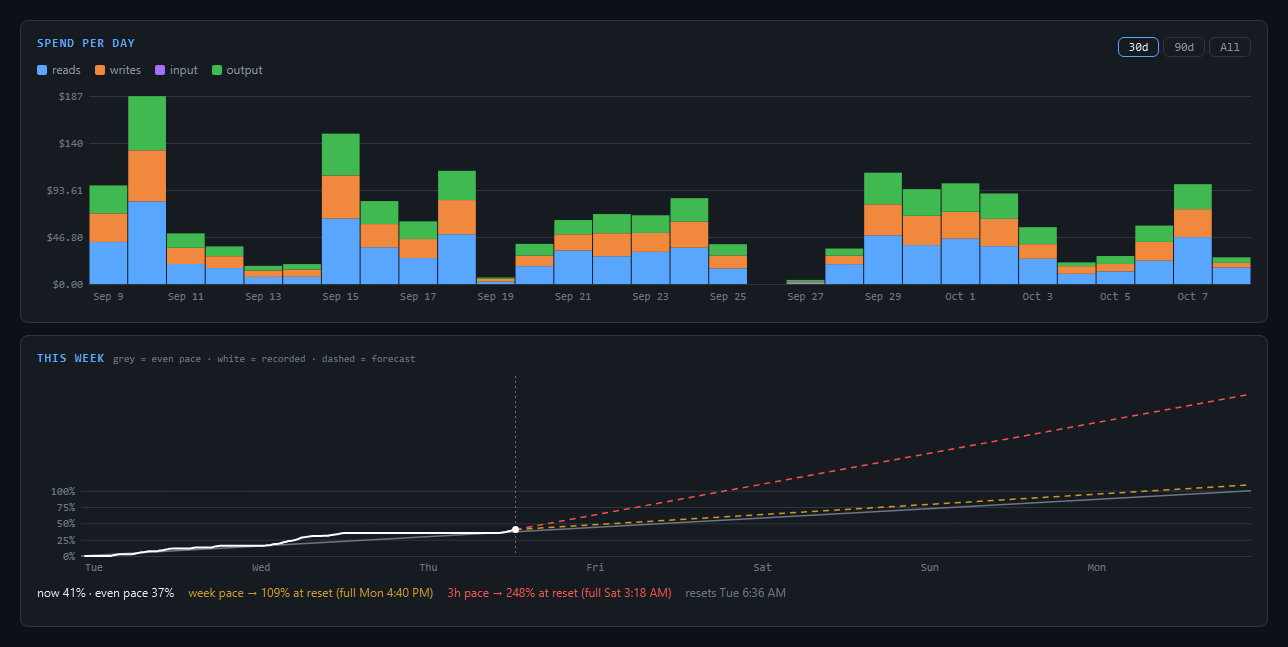
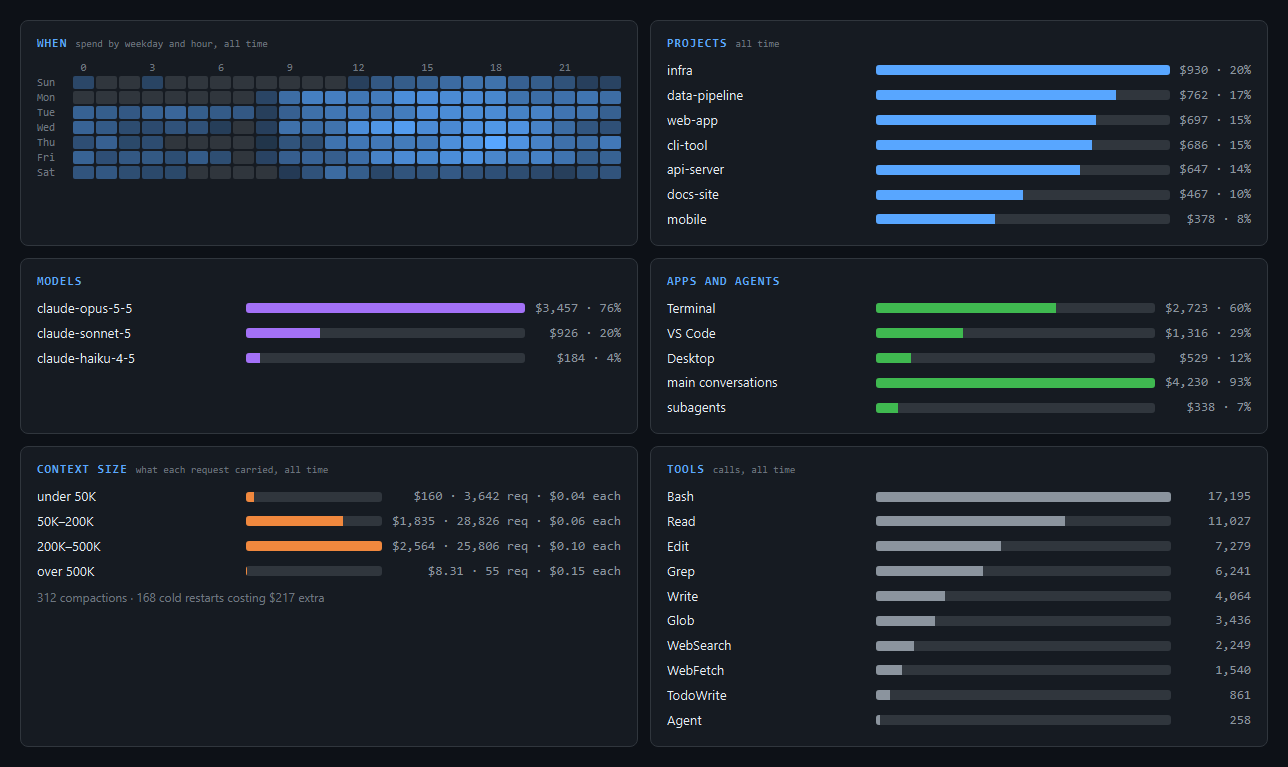
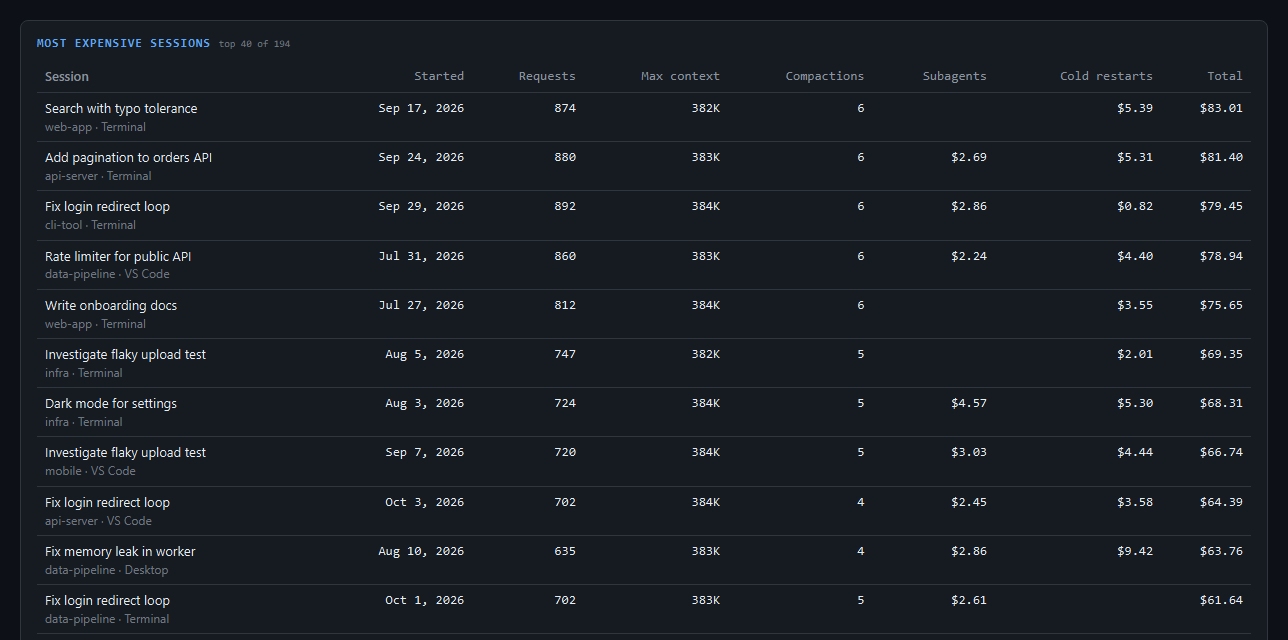
<sub>Screenshots use the made-up history from --demo. Run npx github:Siigari/usage-panel --demo to see it yourself.</sub>
Type /meter in a session for this pane beside the conversation:
SPEND list $                PRESSURE                   TODAY'S MIX                FORECAST                   PLAN whole account
5m       $1.19 · 10 req     now          $14.33/h      reads     $76.52 · 72%     end of day     ~$149.47    5-hour     12%  ↻ 11:20 PM
30m      $8.68 · 74 req     1h pace      $12.15/h      writes    $12.97 · 12%     next 24h       ~$291.55    ━━━━━━━━━━━━━━━━━━━━━━━━━━━
1h     $12.15 · 103 req     req/h             103      input      $7.39 · 7%      context      479K / 1M     weekly     10%  ↻ Thu 11 AM
today $105.64 · 1077 req    cache hit        100%      output     $8.76 · 8%      full in         ~5.7 h     ━━━━━━━━━━━━━━━━━━━━━━━━━━━
                                                                                                             forecast   full Sun 6 AM
■ reads  ■ writes  ■ input  ■ output  ─ context
[stacked bars: dollars per 5 minutes, with this session's context as a line]

THIS WEEK  grey = even pace · white = recorded · dashed = forecast · top = 100%
[the plan week from start to reset: even pace, what you've used, and where two paces land]
now 10%, 4 pts behind even pace
week pace → 18% at reset
3h pace → 140% at reset (full Sun 6 AM)
resets Thu 11 AMYou need Claude Code 2.1.287 or newer (claude --version; claude update if older).
claude plugin marketplace add Siigari/usage-panel
claude plugin install usage-panel@siigari
Or from inside a session: /plugin install usage-panel --marketplace Siigari/usage-panel.
Restart Claude Code (or run /reload-plugins), then type /meter to open the pane. /meter again, or Esc, closes it.
/meter web (or npx github:Siigari/usage-panel from any shell, no install) reads ~/.claude/projects/, writes ~/.claude/usage-reader/report.html, and opens it. It needs Node.js 18 or newer. --demo shows the report with a made-up history instead of yours.
The first run reads everything (about 10 seconds for 12 GB of transcripts); after that only the sessions that changed are reread. npx github:Siigari/usage-panel --watch keeps it fresh: it rescans every minute and the page reloads itself.
The report grades the last 30 days on four things and lists what stands out, most expensive first:
It also shows spend per day (stacked by reads, writes, input, and output), a weekday-by-hour heatmap, spend by project, model, and app, context size buckets, tool calls, and the 40 most expensive sessions.
The plan percent on the report comes from the same account-usage call Claude Code's /usage screen makes, using the login Claude Code saved on this computer (--offline skips it). The week chart's recorded line comes from readings the report and the /meter pane save. Its red 3h pace is measured from those readings once they cover 45 minutes of the last 3 hours; until then it is estimated from spend (the week's percent per list-price dollar so far, times what the last 3 hours cost) and labeled "est."
The pane draws in claude in a terminal (VS Code's built-in terminal counts) and in the Code tab of the Claude Desktop app. The VS Code extension's chat panel doesn't draw mods, but sessions there still record their usage, so the numbers stay complete.
In a wide terminal the pane sits beside the conversation; in a narrow one it sits above the prompt. Ctrl+X then an arrow key resizes it.
/usage shows. It only appears on a subscription, after the first reply in a session.~/.claude/plugins/store/). The report is a file on your disk; its only network call is the plan-percent reading from Anthropic, which --offline skips.claude --plugin-dir ./usage-panel # load it from a checkout; edits reload on save
claude plugin validate --strict . # what Claude Code reads from the hooks
claude plugin test # tests in tests/ (set SHOW = true in the test to print the charts)
node reader/usage-reader.js --json # the report's data, without the pageBuilt and tested with Claude Code 2.1.295.
hooks/register.js 157 lines1// usage-panel: records what each model request costs and the plan's 5-hour and weekly percent, and draws them in a
2// pane that /meter opens and closes.
3//
4// Storage ($.store, shared by every session on this machine):
5// req:<day>:<session> this session's requests that day, written by this session only, so sessions never race
6// plan:<day> plan readings that day; account-wide, so every session adds to the same list
7// Request rows keep 2 days, plan rows 8 (the week chart needs the whole week).
8
9import { summarize } from './stats.js'
10import { drawPanel } from './draw.js'
11
12const PANE = 'usage-panel'
13const KEEP_REQ_DAYS = 2
14const KEEP_PLAN_DAYS = 8
15const REFRESH_MS = 20000
16
17let mine = { day: '', req: [] } // this session's rows for today, as saved under its own key
18let all = { req: [], plan: [] } // every session's rows, read from the store when the pane opens and on a timer
19let isOpen = false
20
21const nowSec = () => Math.floor(Date.now() / 1000)
22const pad = (n) => String(n).padStart(2, '0')
23const dayOf = (sec) => { const d = new Date(sec * 1000); return `${d.getFullYear()}-${pad(d.getMonth() + 1)}-${pad(d.getDate())}` }
24const daysAgo = (day) => (Date.parse(dayOf(nowSec()) + 'T00:00:00') - Date.parse(day + 'T00:00:00')) / 864e5
25const byTime = (a, b) => a[0] - b[0]
26
27async function sessionTag($) {
28 return String(await $.session.id()).slice(0, 8)
29}
30
31// Reads every saved row; drops days older than we keep
32async function refresh($, prune) {
33 const keys = await $.store.keys()
34 const req = [], plan = []
35 for (const key of keys) {
36 const [kind, day] = key.split(':')
37 if (kind !== 'req' && kind !== 'plan') continue
38 const age = daysAgo(day)
39 if (age >= (kind === 'req' ? KEEP_REQ_DAYS : KEEP_PLAN_DAYS)) {
40 if (prune) await $.store.delete(key)
41 continue
42 }
43 const rows = await $.store.get(key)
44 if (Array.isArray(rows)) (kind === 'req' ? req : plan).push(...rows)
45 }
46 all = { req: req.sort(byTime), plan: plan.sort(byTime) }
47}
48
49async function recordRequest($, usage) {
50 const t = nowSec(), day = dayOf(t), tag = await sessionTag($)
51 if (mine.day !== day || mine.tag !== tag) mine = { day, tag, req: (await $.store.get(`req:${day}:${tag}`)) || [] }
52 const row = [t, usage.model || '', usage.input_tokens || 0, usage.cache_read_input_tokens || 0, usage.cache_creation_input_tokens || 0, usage.output_tokens || 0, tag]
53 mine.req.push(row)
54 all.req.push(row)
55 await $.store.set(`req:${day}:${tag}`, mine.req)
56 if (isOpen) $.ui.invalidate('ui.render')
57}
58
59function planRow(rateLimits, t) {
60 const five = rateLimits.find((r) => r.kind === 'five_hour')
61 const week = rateLimits.find((r) => r.kind === 'seven_day')
62 if (!five && !week) return null
63 const sec = (iso) => (iso ? Math.floor(Date.parse(iso) / 1000) : 0)
64 return [t, five ? five.percentUsed : null, week ? week.percentUsed : null, sec(five && five.resetsAt), sec(week && week.resetsAt)]
65}
66
67function withLive(plan, rateLimits, now) {
68 const row = planRow(rateLimits, now)
69 return row ? [...plan, row] : plan
70}
71
72async function recordPlan($, rateLimits) {
73 const t = nowSec()
74 const row = planRow(rateLimits, t)
75 if (!row) return
76 const last = all.plan[all.plan.length - 1]
77 const same = last && last[1] === row[1] && last[2] === row[2] && last[4] === row[4]
78 if (same && t - last[0] < 600) return
79 // Read again right before writing: other sessions add to the same day's list
80 const key = `plan:${dayOf(t)}`
81 const saved = (await $.store.get(key)) || []
82 saved.push(row)
83 await $.store.set(key, saved)
84 all.plan.push(row)
85 if (isOpen) $.ui.invalidate('ui.render')
86}
87
88export function register(on) {
89 on('session.start', async ($, e, next) => {
90 await $.command.register({ name: 'meter', description: 'Open or close the usage panel; /meter web opens the full report', argumentHint: '[web]', immediate: true })
91 await refresh($, true)
92 $.clock.every(REFRESH_MS, () => {
93 if (isOpen) refresh($, false).then(() => $.ui.invalidate('ui.render'))
94 })
95 return next(e)
96 })
97
98 // Every model request, main conversation and subagents alike: let it run, then note what it cost
99 on('turn.step', async function* ($, e, next) {
100 const result = yield* next(e)
101 if (result && result.usage) {
102 try { await recordRequest($, result.usage) } catch {}
103 }
104 return result
105 })
106
107 // The plan's percent moved, or the context did
108 on('session.measure', async ($, e, next) => {
109 if (e.rateLimits && e.rateLimits.length) {
110 try { await recordPlan($, e.rateLimits) } catch {}
111 }
112 if (isOpen) $.ui.invalidate('ui.render')
113 return next(e)
114 })
115
116 on('command.run', { command: 'meter' }, async ($, e) => {
117 if (String(e.args || '').trim() === 'web') {
118 $.ui.toast('Reading your Claude Code transcripts…')
119 try {
120 const r = await $.process.run(['node', $.plugin.root + '/reader/usage-reader.js'], { timeoutMs: 600000 })
121 if (r.exitCode === 0) return { text: 'Opened the usage report in your browser. ' + (r.stderr.trim().split('\n').pop() || '') }
122 return { text: 'The usage report failed:\n' + (r.stderr || r.stdout).trim().slice(-1500) }
123 } catch {
124 return { text: 'The usage report needs Node.js 18 or newer (nodejs.org). With Node installed, `npx github:Siigari/usage-panel` runs it too.' }
125 }
126 }
127 const panes = await $.ui.panes()
128 if (panes.some((p) => p.id === PANE)) {
129 await $.ui.close({ id: PANE })
130 isOpen = false
131 } else {
132 await refresh($, false)
133 isOpen = true
134 await $.ui.open({ id: PANE, title: 'Usage', closeOnEscape: true })
135 }
136 return {}
137 })
138
139 on('ui.close', async ($, e, next) => {
140 if (e.id === PANE) isOpen = false
141 return next(e)
142 })
143
144 on('ui.render', { component: 'Pane' }, async ($, e, next) => {
145 if (e.requestId !== PANE) return next(e)
146 isOpen = true
147 const usage = await $.session.usage()
148 const tag = await sessionTag($)
149 const now = nowSec()
150 // The live reading counts even before session.measure has saved one
151 const plan = withLive(all.plan, usage.rateLimits || [], now)
152 const data = { now, mine: tag, rows: all.req, plan, context: usage.context }
153 data.summary = summarize(all.req, plan, { now, mine: tag, context: usage.context })
154 return drawPanel($.ui.resolve(e), e.surface, e.props.bodyColumns, data)
155 })
156}
157hooks/stats.js 157 lines1// stats.js: the panel's numbers, worked out from saved rows. No mods API here, so tests can call it directly.
2//
3// A request row is [t, model, input, cacheRead, cacheWrite, output, session] with t in epoch seconds.
4// A plan row is [t, fiveHourPct, weekPct, fiveHourResetSec, weekResetSec].
5
6// List prices in US dollars per million tokens. A cache write is priced at the 1-hour rate (2x input), which is
7// what Claude Code uses on a subscription; a cache read is 0.1x input unless the model says otherwise.
8const PRICES = [
9 [/fable-5-1|mythos-5-1/, { in: 10, out: 50, cr: 0.25 }],
10 [/fable|mythos/, { in: 10, out: 50 }],
11 [/opus-5-5/, { in: 4, out: 20, cr: 0.2 }],
12 [/opus-4-1|opus-4-0|opus-4-2025|opus-4$/, { in: 15, out: 75 }],
13 [/opus/, { in: 5, out: 25 }],
14 [/sonnet-5/, { in: 2, out: 10 }],
15 [/sonnet/, { in: 3, out: 15 }],
16 [/haiku-3-5/, { in: 0.8, out: 4 }],
17 [/haiku/, { in: 1, out: 5 }],
18]
19const FALLBACK = { in: 5, out: 25 }
20
21export function priceOf(model) {
22 const m = String(model || '').toLowerCase()
23 const hit = PRICES.find(([re]) => re.test(m))
24 const p = hit ? hit[1] : FALLBACK
25 return { in: p.in, out: p.out, cr: p.cr ?? p.in * 0.1, cw: p.in * 2, cw5: p.in * 1.25 }
26}
27
28// One request's dollars, split the way the panel shows them
29export function costOf(row) {
30 const p = priceOf(row[1])
31 const reads = (row[3] * p.cr) / 1e6
32 const writes = (row[4] * p.cw) / 1e6
33 const input = (row[2] * p.in) / 1e6
34 const output = (row[5] * p.out) / 1e6
35 return { reads, writes, input, output, total: reads + writes + input + output }
36}
37
38const H = 3600
39const sumCost = (rows) => rows.reduce((s, r) => s + costOf(r).total, 0)
40
41export function startOfDay(nowSec) {
42 const d = new Date(nowSec * 1000)
43 d.setHours(0, 0, 0, 0)
44 return Math.floor(d.getTime() / 1000)
45}
46
47// Everything the text blocks show. `rows` is every saved request, `plan` every saved plan reading, both sorted by t.
48// `mine` is this session's id, so the context forecast reads this session only.
49export function summarize(rows, plan, { now, mine, context }) {
50 const since = (sec) => rows.filter((r) => r[0] > now - sec)
51 const dayStart = startOfDay(now)
52 const today = rows.filter((r) => r[0] >= dayStart)
53 const last5m = since(300), last30m = since(1800), last1h = since(H)
54
55 const mix = { reads: 0, writes: 0, input: 0, output: 0 }
56 for (const r of today) {
57 const c = costOf(r)
58 mix.reads += c.reads; mix.writes += c.writes; mix.input += c.input; mix.output += c.output
59 }
60 const todayUsd = mix.reads + mix.writes + mix.input + mix.output
61
62 // Cache hit: of the prompt tokens read in the last hour, how many came from the cache
63 let cr = 0, prompt = 0
64 for (const r of last1h) { cr += r[3]; prompt += r[2] + r[3] + r[4] }
65
66 const hourUsd = sumCost(last1h)
67 const endOfDayHours = (dayStart + 24 * H - now) / H
68
69 return {
70 spend: {
71 m5: { usd: sumCost(last5m), n: last5m.length },
72 m30: { usd: sumCost(last30m), n: last30m.length },
73 h1: { usd: hourUsd, n: last1h.length },
74 today: { usd: todayUsd, n: today.length },
75 },
76 pressure: {
77 nowPerHour: sumCost(last5m) * 12,
78 hourPace: hourUsd,
79 reqPerHour: last1h.length,
80 cacheHit: prompt ? cr / prompt : null,
81 },
82 mix: { ...mix, total: todayUsd },
83 forecast: {
84 endOfDay: todayUsd + hourUsd * endOfDayHours,
85 next24h: hourUsd * 24,
86 context: context || null,
87 fullIn: contextFullIn(rows.filter((r) => r[6] === mine), now, context),
88 },
89 plan: planNow(plan, now),
90 }
91}
92
93// Hours until this session's context reaches its window, from how fast it grew over the last hour
94function contextFullIn(rows, now, context) {
95 if (!context || !context.tokens || !context.window) return null
96 const recent = rows.filter((r) => r[0] > now - H)
97 if (recent.length < 2) return null
98 const a = recent[0], b = recent[recent.length - 1]
99 const ctx = (r) => r[2] + r[3] + r[4]
100 const hours = (b[0] - a[0]) / H
101 if (hours < 0.1) return null
102 const perHour = (ctx(b) - ctx(a)) / hours
103 if (perHour <= 0) return null
104 return Math.max(0, (context.window - context.tokens) / perHour)
105}
106
107// The plan's latest reading and where its week is heading
108export function planNow(plan, now) {
109 if (!plan.length) return null
110 const last = plan[plan.length - 1]
111 const [, u5, u7, r5, r7] = last
112 const out = { u5, u7, r5, r7, ageMin: Math.round((now - last[0]) / 60) }
113 if (u7 == null || !r7) return out
114 const weekStart = r7 - 7 * 24 * H
115 const elapsed = Math.max(H / 4, now - weekStart)
116 out.weekPace = (u7 / elapsed) * H // points per hour since the week began
117 out.recentPace = recentPace(plan, now, r7)
118 const pace = out.recentPace ?? out.weekPace
119 if (pace > 0) {
120 const fullAt = now + ((100 - u7) / pace) * H
121 out.fullAt = fullAt < r7 ? fullAt : null
122 }
123 out.weekPaceAtReset = u7 + out.weekPace * ((r7 - now) / H)
124 if (out.recentPace != null) out.recentPaceAtReset = u7 + out.recentPace * ((r7 - now) / H)
125 return out
126}
127
128// Points per hour over the last three hours, from readings in the same week; null without 45 minutes of readings
129function recentPace(plan, now, r7) {
130 const same = plan.filter((p) => p[4] === r7 && p[2] != null && p[0] > now - 3 * H)
131 if (same.length < 2) return null
132 const a = same[0], b = same[same.length - 1]
133 if (b[0] - a[0] < 45 * 60) return null
134 return (b[2] - a[2]) / ((b[0] - a[0]) / H)
135}
136
137// Dollars per bucket for the bar chart, oldest first, split into the four kinds; `ctx` is the largest context
138// one of `mine`'s requests in the bucket carried (0 when it made none)
139export function buckets(rows, now, count, bucketSec, mine) {
140 const end = Math.floor(now / bucketSec) * bucketSec + bucketSec
141 const start = end - count * bucketSec
142 const out = Array.from({ length: count }, (_, i) => ({ t: start + i * bucketSec, reads: 0, writes: 0, input: 0, output: 0, ctx: 0 }))
143 for (const r of rows) {
144 if (r[0] < start || r[0] >= end) continue
145 const b = out[Math.floor((r[0] - start) / bucketSec)]
146 const c = costOf(r)
147 b.reads += c.reads; b.writes += c.writes; b.input += c.input; b.output += c.output
148 if (r[6] === mine) b.ctx = Math.max(b.ctx, r[2] + r[3] + r[4])
149 }
150 return out
151}
152
153// The week's recorded line: [t, weekPct] for readings in the current week only
154export function weekSeries(plan, r7) {
155 return plan.filter((p) => p[4] === r7 && p[2] != null).map((p) => [p[0], p[2]])
156}
157hooks/draw.js 353 lines1// draw.js: turns the numbers into an element tree. No mods API here: the hook passes in the elements it resolved,
2// so this file only builds trees, Raster cells, and SVG text.
3
4import { buckets, weekSeries } from './stats.js'
5
6export const C = {
7 title: '#58a6ff',
8 label: '#8b949e',
9 value: '#e6edf3',
10 dim: '#6e7681',
11 reads: '#58a6ff',
12 writes: '#f0883e',
13 input: '#a371f7',
14 output: '#3fb950',
15 ctx: '#e6edf3',
16 even: '#6e7681',
17 weekPace: '#d29922',
18 recentPace: '#f85149',
19 recorded: '#ffffff',
20 barUsed: '#3fb950',
21 barWarm: '#d29922',
22 barHot: '#f85149',
23 barEmpty: '#30363d',
24}
25
26const DEFAULT = 0x01000000
27const hex = (c) => parseInt(c.slice(1), 16)
28const H = 3600
29const BUCKET = 300
30
31// ---------- words ----------
32
33export function money(d) {
34 if (d == null || !isFinite(d)) return '–'
35 return '$' + d.toLocaleString('en-US', { minimumFractionDigits: 2, maximumFractionDigits: 2 })
36}
37export function tokens(n) {
38 if (!n) return '0'
39 if (n >= 1e6) return (n / 1e6).toFixed(n >= 1e7 ? 0 : 1).replace(/\.0$/, '') + 'M'
40 if (n >= 1e3) return Math.round(n / 1e3) + 'K'
41 return String(n)
42}
43const pct = (p) => (p == null ? '–' : Math.round(p) + '%')
44const clock = (sec) => new Date(sec * 1000).toLocaleTimeString('en-US', { hour: 'numeric', minute: '2-digit' })
45const dayHour = (sec) => {
46 const d = new Date(sec * 1000)
47 const day = d.toLocaleDateString('en-US', { weekday: 'short' })
48 const h = d.toLocaleTimeString('en-US', { hour: 'numeric', minute: d.getMinutes() ? '2-digit' : undefined })
49 return day + ' ' + h
50}
51const hourLabel = (sec) => new Date(sec * 1000).toLocaleTimeString('en-US', { hour: 'numeric' })
52const dayLabel = (sec) => new Date(sec * 1000).toLocaleDateString('en-US', { weekday: 'short' })
53
54// ---------- the text blocks ----------
55
56const BLOCK = 27
57
58function row(E, label, value, color) {
59 return E.Box({
60 flexDirection: 'row',
61 justifyContent: 'space-between',
62 width: BLOCK,
63 children: [
64 E.Text({ color: C.label, wrap: 'truncate-end', children: [label] }),
65 E.Text({ color: color || C.value, children: [value] }),
66 ],
67 })
68}
69
70function block(E, title, note, rows) {
71 const head = [E.Text({ color: C.title, bold: true, children: [title] })]
72 if (note) head.push(E.Text({ color: C.dim, children: [' ' + note] }))
73 return E.Box({
74 flexDirection: 'column',
75 width: BLOCK,
76 children: [E.Box({ flexDirection: 'row', children: head }), ...rows],
77 })
78}
79
80function meter(E, p) {
81 const n = BLOCK, used = Math.max(0, Math.min(n, Math.round(((p || 0) / 100) * n)))
82 const color = p >= 90 ? C.barHot : p >= 67 ? C.barWarm : C.barUsed
83 return E.Box({
84 flexDirection: 'row',
85 children: [
86 E.Text({ color, children: ['━'.repeat(used)] }),
87 E.Text({ color: C.barEmpty, children: ['━'.repeat(n - used)] }),
88 ],
89 })
90}
91
92function blocks(E, s) {
93 const { spend, pressure, mix, forecast, plan } = s
94 const share = (v) => (mix.total ? Math.round((v / mix.total) * 100) + '%' : '–')
95 const out = [
96 block(E, 'SPEND', 'list $', [
97 row(E, '5m', `${money(spend.m5.usd)} · ${spend.m5.n} req`),
98 row(E, '30m', `${money(spend.m30.usd)} · ${spend.m30.n} req`),
99 row(E, '1h', `${money(spend.h1.usd)} · ${spend.h1.n} req`),
100 row(E, 'today', `${money(spend.today.usd)} · ${spend.today.n} req`),
101 ]),
102 block(E, 'PRESSURE', '', [
103 row(E, 'now', money(pressure.nowPerHour) + '/h'),
104 row(E, '1h pace', money(pressure.hourPace) + '/h'),
105 row(E, 'req/h', String(pressure.reqPerHour)),
106 row(E, 'cache hit', pressure.cacheHit == null ? '–' : Math.round(pressure.cacheHit * 100) + '%'),
107 ]),
108 block(E, "TODAY'S MIX", '', [
109 row(E, 'reads', `${money(mix.reads)} · ${share(mix.reads)}`, C.reads),
110 row(E, 'writes', `${money(mix.writes)} · ${share(mix.writes)}`, C.writes),
111 row(E, 'input', `${money(mix.input)} · ${share(mix.input)}`, C.input),
112 row(E, 'output', `${money(mix.output)} · ${share(mix.output)}`, C.output),
113 ]),
114 block(E, 'FORECAST', '', [
115 row(E, 'end of day', '~' + money(forecast.endOfDay)),
116 row(E, 'next 24h', '~' + money(forecast.next24h)),
117 row(E, 'context', forecast.context && forecast.context.tokens != null ? `${tokens(forecast.context.tokens)} / ${tokens(forecast.context.window)}` : '–'),
118 row(E, 'full in', forecast.fullIn == null ? '–' : '~' + forecast.fullIn.toFixed(1) + ' h'),
119 ]),
120 ]
121 if (plan) {
122 const fc = plan.fullAt ? 'full ' + dayHour(plan.fullAt) : plan.u7 != null ? 'lasts to reset' : '–'
123 out.push(block(E, 'PLAN', 'whole account', [
124 row(E, '5-hour', `${pct(plan.u5)} ↻ ${plan.r5 ? clock(plan.r5) : '–'}`),
125 meter(E, plan.u5),
126 row(E, 'weekly', `${pct(plan.u7)} ↻ ${plan.r7 ? dayHour(plan.r7) : '–'}`),
127 meter(E, plan.u7),
128 row(E, 'forecast', fc, plan.fullAt ? C.weekPace : C.value),
129 ]))
130 } else {
131 out.push(block(E, 'PLAN', 'whole account', [
132 E.Text({ color: C.dim, wrap: 'wrap', children: ['Shows after the next reply on a Pro or Max plan.'] }),
133 ]))
134 }
135 return E.Box({ flexDirection: 'row', flexWrap: 'wrap', columnGap: 2, rowGap: 1, children: out })
136}
137
138// ---------- Raster helpers (terminal) ----------
139
140function pack(words) {
141 return new Uint8Array(Uint32Array.from(words).buffer).toBase64()
142}
143
144// A line of text laid out by column: each [col, text] is written at its column, later ones skipped if they'd overlap
145function ruler(cols, marks) {
146 const line = Array(cols).fill(' ')
147 let free = 0
148 for (const [col, text] of marks) {
149 if (col < free || col + text.length > cols) continue
150 for (let i = 0; i < text.length; i++) line[col + i] = text[i]
151 free = col + text.length + 1
152 }
153 return line.join('')
154}
155
156// ---------- the spend chart ----------
157
158const KINDS = ['reads', 'writes', 'input', 'output']
159
160function spendRaster(E, bs, cols, rows, window) {
161 const max = Math.max(0.01, ...bs.map((b) => b.reads + b.writes + b.input + b.output))
162 const units = rows * 8
163 const cells = new Array(cols * rows * 3)
164 for (let x = 0; x < cols; x++) {
165 const b = bs[x]
166 // Boundaries in eighths of a cell, bottom up: where each kind ends
167 let acc = 0
168 const tops = KINDS.map((k) => (acc += b[k], Math.round((acc / max) * units)))
169 const colorAt = (u) => { const i = tops.findIndex((t) => u < t); return i < 0 ? null : hex(C[KINDS[i]]) }
170 const ctxRow = b.ctx && window ? Math.min(rows - 1, Math.floor((b.ctx / window) * rows)) : -1
171 for (let r = 0; r < rows; r++) {
172 const lo = r * 8, y = rows - 1 - r, at = (y * cols + x) * 3
173 const below = colorAt(lo)
174 let ch = 0x20, fg = DEFAULT, bg = DEFAULT
175 if (below != null) {
176 const next = tops.find((t) => t > lo && t < lo + 8)
177 if (next == null) { ch = 0x2588; fg = below }
178 else { ch = 0x2580 + (next - lo); fg = below; const above = colorAt(next); bg = above == null ? DEFAULT : above }
179 }
180 if (r === ctxRow) { bg = fg === DEFAULT ? bg : fg; ch = 0x2500; fg = hex(C.ctx) }
181 cells[at] = ch; cells[at + 1] = fg; cells[at + 2] = bg
182 }
183 }
184 return { raster: E.Raster({ key: 'spend', columns: cols, rows, cells: pack(cells) }), max }
185}
186
187function spendSvg(E, bs, width, height, window) {
188 const max = Math.max(0.01, ...bs.map((b) => b.reads + b.writes + b.input + b.output))
189 const bw = width / bs.length
190 let rects = ''
191 let ctxPts = []
192 bs.forEach((b, i) => {
193 let y = height
194 for (const k of KINDS) {
195 const h = (b[k] / max) * height
196 if (h > 0.2) rects += `<rect x="${(i * bw + 0.5).toFixed(1)}" y="${(y - h).toFixed(1)}" width="${Math.max(1, bw - 1).toFixed(1)}" height="${h.toFixed(1)}" fill="${C[k]}"/>`
197 y -= h
198 }
199 if (b.ctx && window) ctxPts.push(`${(i * bw + bw / 2).toFixed(1)},${(height - (b.ctx / window) * height).toFixed(1)}`)
200 })
201 const line = ctxPts.length > 1 ? `<polyline points="${ctxPts.join(' ')}" fill="none" stroke="${C.ctx}" stroke-width="1.5"/>` : ''
202 const source = `<svg xmlns="http://www.w3.org/2000/svg" width="${width}" height="${height}" viewBox="0 0 ${width} ${height}">${rects}${line}</svg>`
203 return { svg: E.Svg({ source, alt: 'Spend per five minutes, stacked by reads, writes, input, and output', width, height }), max }
204}
205
206function spendChart(E, svgMode, data, cols) {
207 const count = Math.max(12, cols)
208 const bs = buckets(data.rows, data.now, count, BUCKET, data.mine)
209 const window = data.context && data.context.window
210 const legend = E.Box({
211 flexDirection: 'row',
212 columnGap: 2,
213 children: [
214 ...KINDS.map((k) => E.Text({ color: C[k], children: ['■ ' + k] })),
215 E.Text({ color: C.ctx, children: ['─ context'] }),
216 ],
217 })
218 const chart = svgMode ? spendSvg(E, bs, cols * 8, 110, window) : spendRaster(E, bs, cols, 7, window)
219 const marks = []
220 bs.forEach((b, i) => { if (b.t % H === 0) marks.push([i, hourLabel(b.t)]) })
221 const ctxNote = data.context && data.context.tokens ? ` · this session ${tokens(data.context.tokens)} ctx` : ''
222 return [
223 legend,
224 E.Text({ color: C.dim, children: [`top = ${money(chart.max)} per 5 min${ctxNote}`] }),
225 chart.raster || chart.svg,
226 svgMode ? null : E.Text({ color: C.dim, children: [ruler(cols, marks)] }),
227 ].filter(Boolean)
228}
229
230// ---------- the week chart ----------
231
232// Braille canvas: each cell is 2 dots wide and 4 tall; a cell takes the color of the last line drawn through it
233function canvas(cols, rows) {
234 const W = cols * 2, Hh = rows * 4
235 const bits = new Uint8Array(cols * rows)
236 const color = new Uint32Array(cols * rows).fill(DEFAULT)
237 const DOT = [[0x01, 0x08], [0x02, 0x10], [0x04, 0x20], [0x40, 0x80]]
238 function dot(x, y, c) {
239 x = Math.round(x); y = Math.round(y)
240 if (x < 0 || y < 0 || x >= W || y >= Hh) return
241 const i = Math.floor(y / 4) * cols + Math.floor(x / 2)
242 bits[i] |= DOT[y % 4][x % 2]
243 color[i] = c
244 }
245 function line(x0, y0, x1, y1, c, dash) {
246 const steps = Math.max(1, Math.ceil(Math.max(Math.abs(x1 - x0), Math.abs(y1 - y0))))
247 for (let s = 0; s <= steps; s++) {
248 if (dash && Math.floor(s / 3) % 2 === 1) continue
249 dot(x0 + ((x1 - x0) * s) / steps, y0 + ((y1 - y0) * s) / steps, c)
250 }
251 }
252 function cells() {
253 const out = new Array(cols * rows * 3)
254 for (let i = 0; i < cols * rows; i++) {
255 out[i * 3] = bits[i] ? 0x2800 + bits[i] : 0x20
256 out[i * 3 + 1] = bits[i] ? color[i] : DEFAULT
257 out[i * 3 + 2] = DEFAULT
258 }
259 return out
260 }
261 return { W, H: Hh, dot, line, cells }
262}
263
264function weekLines(plan, now) {
265 const r7 = plan.r7, start = r7 - 7 * 24 * H
266 const lines = [{ color: C.even, dash: false, pts: [[start, 0], [r7, 100]] }]
267 lines.push({ color: C.weekPace, dash: true, pts: [[now, plan.u7], [r7, plan.weekPaceAtReset]] })
268 if (plan.recentPaceAtReset != null) lines.push({ color: C.recentPace, dash: true, pts: [[now, plan.u7], [r7, plan.recentPaceAtReset]] })
269 return { start, lines }
270}
271
272function weekRaster(E, data, plan, cols, rows) {
273 const cv = canvas(cols, rows)
274 const { start, lines } = weekLines(plan, data.now)
275 const X = (t) => ((t - start) / (plan.r7 - start)) * (cv.W - 1)
276 const Y = (p) => (cv.H - 1) - (Math.min(100, Math.max(0, p)) / 100) * (cv.H - 1)
277 // A forecast past 100% is drawn to where it crosses 100%, then stops
278 const clip = ([t0, p0], [t1, p1]) => (p1 <= 100 || p1 === p0 ? [[t0, p0], [t1, p1]] : [[t0, p0], [t0 + ((100 - p0) / (p1 - p0)) * (t1 - t0), 100]])
279 for (let y = 0; y < cv.H; y += 2) cv.dot(X(data.now), y, hex(C.dim))
280 for (const l of lines) { const [a, b] = clip(l.pts[0], l.pts[1]); cv.line(X(a[0]), Y(a[1]), X(b[0]), Y(b[1]), hex(l.color), l.dash) }
281 const rec = weekSeries(data.plan, plan.r7)
282 for (let i = 1; i < rec.length; i++) cv.line(X(rec[i - 1][0]), Y(rec[i - 1][1]), X(rec[i][0]), Y(rec[i][1]), hex(C.recorded), false)
283 if (rec.length) cv.dot(X(rec[rec.length - 1][0]), Y(rec[rec.length - 1][1]), hex(C.recorded))
284 const marks = []
285 for (let d = 0; d <= 7; d++) {
286 const t = new Date(start * 1000); t.setDate(t.getDate() + d); t.setHours(0, 0, 0, 0)
287 const sec = t.getTime() / 1000
288 if (sec > start && sec < plan.r7) marks.push([Math.round(X(sec) / 2), dayLabel(sec)])
289 }
290 return [
291 E.Raster({ key: 'week', columns: cols, rows, cells: pack(cv.cells()) }),
292 E.Text({ color: C.dim, children: [ruler(cols, marks)] }),
293 ]
294}
295
296function weekSvg(E, data, plan, width, height) {
297 const { start, lines } = weekLines(plan, data.now)
298 const X = (t) => ((t - start) / (plan.r7 - start)) * width
299 const Y = (p) => height - (Math.min(130, Math.max(0, p)) / 130) * height
300 let body = `<line x1="0" y1="${Y(100)}" x2="${width}" y2="${Y(100)}" stroke="${C.barEmpty}"/>`
301 body += `<line x1="${X(data.now)}" y1="0" x2="${X(data.now)}" y2="${height}" stroke="${C.dim}" stroke-dasharray="2 3"/>`
302 for (const l of lines) body += `<line x1="${X(l.pts[0][0])}" y1="${Y(l.pts[0][1])}" x2="${X(l.pts[1][0])}" y2="${Y(l.pts[1][1])}" stroke="${l.color}" stroke-width="1.5"${l.dash ? ' stroke-dasharray="5 4"' : ''}/>`
303 const rec = weekSeries(data.plan, plan.r7)
304 if (rec.length > 1) body += `<polyline points="${rec.map(([t, p]) => `${X(t).toFixed(1)},${Y(p).toFixed(1)}`).join(' ')}" fill="none" stroke="${C.recorded}" stroke-width="2"/>`
305 for (let d = 1; d < 7; d++) {
306 const t = new Date(start * 1000); t.setDate(t.getDate() + d); t.setHours(0, 0, 0, 0)
307 const sec = t.getTime() / 1000
308 if (sec < plan.r7) body += `<text x="${X(sec) + 3}" y="${height - 3}" fill="${C.dim}" font-size="10" font-family="sans-serif">${dayLabel(sec)}</text>`
309 }
310 const source = `<svg xmlns="http://www.w3.org/2000/svg" width="${width}" height="${height}" viewBox="0 0 ${width} ${height}">${body}</svg>`
311 return [E.Svg({ source, alt: 'The plan week: even pace, recorded use, and two forecasts', width, height })]
312}
313
314function weekChart(E, svgMode, data, cols) {
315 const plan = data.summary.plan
316 if (!plan || plan.u7 == null || !plan.r7) return []
317 const even = ((data.now - (plan.r7 - 7 * 24 * H)) / (7 * 24 * H)) * 100
318 const ahead = plan.u7 - even
319 const fullNote = (at) => (at >= 100 ? ` (full ${dayHour(data.now + ((100 - plan.u7) / ((at - plan.u7) / ((plan.r7 - data.now) / H))) * H)})` : '')
320 const notes = [
321 E.Text({ color: C.value, children: [`now ${pct(plan.u7)}, ${Math.abs(Math.round(ahead))} pts ${ahead >= 0 ? 'ahead of' : 'behind'} even pace`] }),
322 E.Text({ color: C.weekPace, children: [`week pace → ${pct(plan.weekPaceAtReset)} at reset${fullNote(plan.weekPaceAtReset)}`] }),
323 ]
324 if (plan.recentPaceAtReset != null) notes.push(E.Text({ color: C.recentPace, children: [`3h pace → ${pct(plan.recentPaceAtReset)} at reset${fullNote(plan.recentPaceAtReset)}`] }))
325 notes.push(E.Text({ color: C.dim, children: [`resets ${dayHour(plan.r7)}`] }))
326 const head = E.Box({
327 flexDirection: 'row',
328 columnGap: 2,
329 children: [
330 E.Text({ color: C.title, bold: true, children: ['THIS WEEK'] }),
331 E.Text({ color: C.dim, wrap: 'truncate-end', children: ['grey = even pace · white = recorded · dashed = forecast · top = 100%'] }),
332 ],
333 })
334 const chart = svgMode ? weekSvg(E, data, plan, cols * 8, 120) : weekRaster(E, data, plan, cols, 6)
335 return [head, ...chart, ...notes]
336}
337
338// ---------- the whole pane ----------
339
340export function drawPanel(E, surface, cols, data) {
341 const svgMode = !(surface === 'terminal' && E.Raster) && !!E.Svg
342 const width = Math.max(20, Math.min(cols || 80, 200))
343 const kids = [blocks(E, data.summary)]
344 if (!data.rows.length) {
345 kids.push(E.Text({ color: C.dim, wrap: 'wrap', children: ['No requests recorded yet. The numbers start with your next message, in any session with this plugin on.'] }))
346 } else if (svgMode || E.Raster) {
347 kids.push(E.Text({ children: [' '] }), ...spendChart(E, svgMode, data, width))
348 }
349 const week = svgMode || E.Raster ? weekChart(E, svgMode, data, width) : []
350 if (week.length) kids.push(E.Text({ children: [' '] }), ...week)
351 return E.Box({ flexDirection: 'column', children: kids })
352}
353