odometer
Shows the account's 5-hour and 7-day usage limits above the prompt, with the last turn's speed, and a /tokens pane.
newpanebandcommandtoastprocess

Shows the account's 5-hour and 7-day usage limits above the prompt, with the last turn's speed, and a /tokens pane.

A Claude Code mod that shows your account's 5-hour and 7-day usage limits and, in the terminal, the context window's fill, right above the prompt; and on the line above it the model answering, how fast it answers, and the session's cost. In the terminal the limits and the context sit in a card; in the desktop app the limits sit on the same line as the speed.
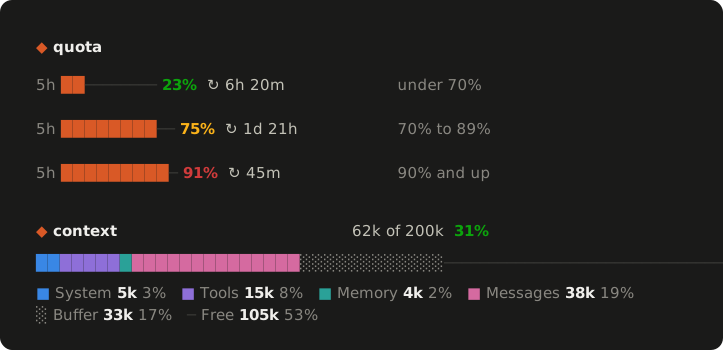
Quota. At the top of the card, under a ◆ quota heading. In the terminal, one line gives each window a bar, its percentage, and ↻ with how long until its reset, like 6h 20m, or 1d 21h from a day away. In the desktop app, the windows sit on the speed row, side by side, each with its label, a solid bar, its percentage in bold, and its reset time; when the band is too narrow for both, the windows move to a row of their own. The desktop app shows the reset as a clock time: just the time if it is later today, otherwise the weekday and time. The bar is in the Claude colour, and the percentage takes the colour of its range: green under 70%, amber from 70%, red from 90%.
Context. In the terminal, below the quota row in the same card: the context window, with its header of tokens against the window, like 92k of 200k, and the fill as a percentage, in the colour of its range: green under 70%, amber from 70%, red from 90%. Below it, the bar has a colour for each group in use (system, tools, memory and messages), a dim ░ for the buffer that auto-compaction keeps back, and a thin ─ for the free space, with the legend under the bar. Until the session's first response, and again after a compaction until the next one, the fill is worked out from the breakdown, so the parts show at once. With no breakdown yet, the header shows the window alone, and the bar says the parts appear after the first response. The band in the desktop app leaves the context out, since the desktop app has its own context panel. The /tokens pane still shows the context in use.
Alerts. When a limit or the context passes 90%, the mod raises one toast. A limit's toast says how long it has left at the pace it has been filling. The context's toast suggests /compact.
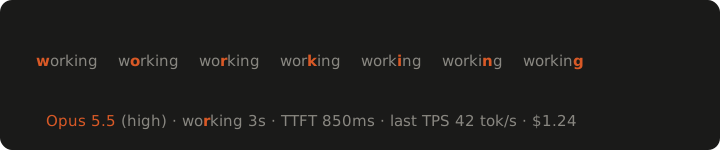
Speed. The row above the prompt shows the latest model step's TTFT (time to first output) and TPS (output tokens per second). While a step runs, it also shows how long the step has run, and a light moves across the word working. A sub-agent's steps are not timed, so the row shows the main conversation's model. The row starts with that model and its effort, and on a wide band ends with the session's cost, as /cost totals it.
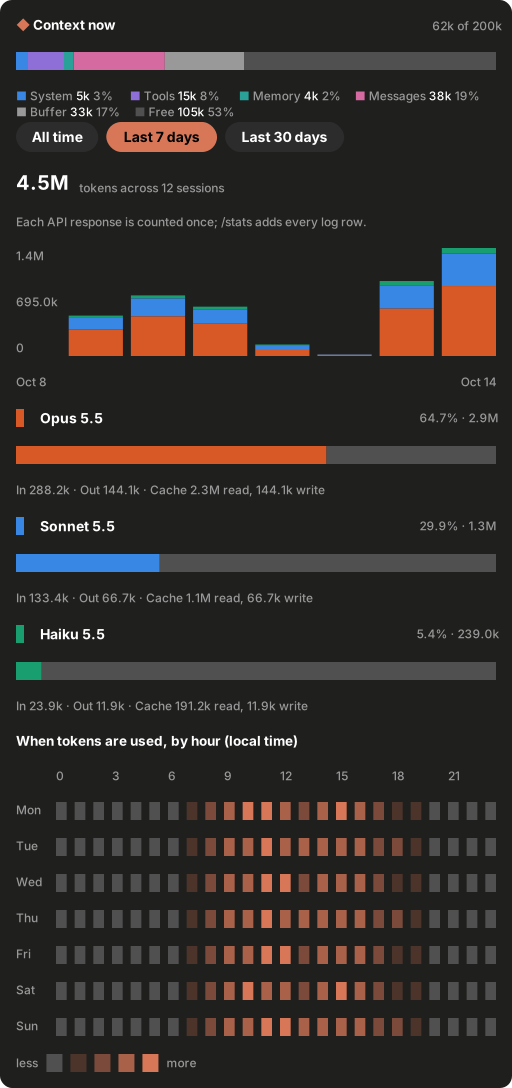
/tokens. A pane with tokens per day by model, for the last 7 days, the last 30 days, or all time. It reads your transcripts; the numbers in the image are example data. At the top, Context now names the context in use, by group. Below the chart, a heatmap shows when tokens were used, by weekday and hour, in local time. In the desktop app the chart and the heatmap are solid colour, the total is in large type, and each model has a bar of its share. In the terminal they are drawn in characters.
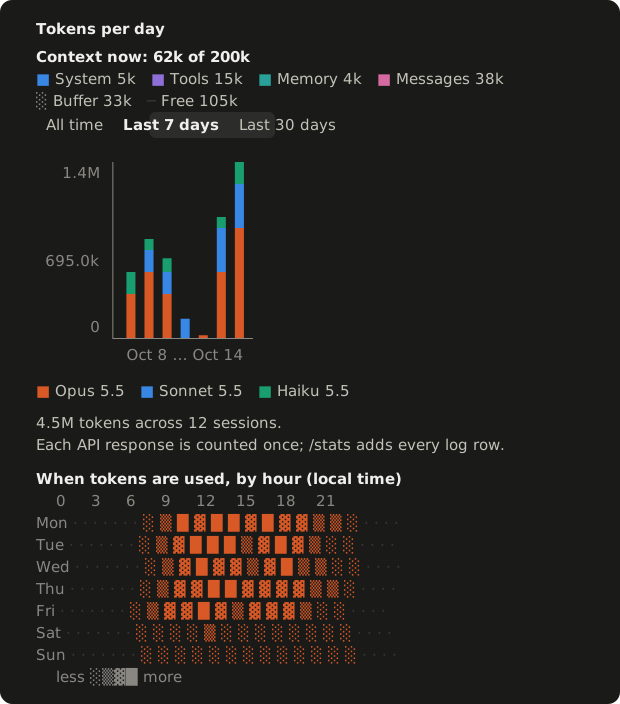
The desktop app draws the band and the /tokens pane with its own elements, not characters. These two images are drawn from the element tree the plugin gives the desktop surface, with example data. Their sizes and spacing are estimates, so the app's own rendering will differ.

In a terminal Claude Code session, version 2.1.275 or later, type:
/plugin install odometer --marketplace nxhung1610/claude-odometerAnswer y to add the marketplace, then press Enter to take the default user scope. The mod is active in that session, and in each session you start after.
To run it from a clone, as you would while developing it:
git clone https://github.com/nxhung1610/claude-odometer.git
claude --plugin-dir /path/to/claude-odometer
/tokens runs hooks/scan_usage.py with Python 3, found as python3 or python on your PATH.
claude plugin test        # run the test suite
claude plugin validate .  # check the manifest and hooks
python3 -m unittest discover -s hooks -p 'test_*.py'  # the transcript scanner's tests
.claude-plugin/types/ is generated by Claude Code when it loads the mod, so it is not committed. tsconfig.json extends that folder, so load the mod once in a session (for example claude --plugin-dir .) before using tsc or the editor's checks.
The plugin is named odometer in plugin.json. The repository is claude-odometer, but a third-party plugin name cannot start with claude-. The state the mod keeps is stored under the plugin's name.
CI (.github/workflows/test.yml) runs the validation, the plugin tests and the scanner tests on Ubuntu and Windows, on pull requests and on pushes to main, with Claude Code 2.1.299. It also checks that package.json and plugin.json agree on the version, that the installer prints its command, and that the illustrations match their scripts in docs/.
session.start reads the current rate-limit windows, the context fill with its breakdown, and the session's cost. It also clears the model and speed of any earlier session.session.measure updates them when the engine reports a change in a window, in the context fill or in the cost. A change of the fill asks for the breakdown again, since a measure does not carry one. A limit or the context that passes 90% raises a toast.ui.render on AbovePrompt draws the model's speed on a row above the prompt, and below it a card with the quota and, in the terminal, the context window. On the desktop app hooks/band.tsx draws the speed and the quota on that one row, with no card; the terminal draws the band in hooks/register.tsx. The band yields while a survey holds it.turn.step times each model step of the main conversation; a sub-agent's steps pass on untimed, since sub-agents can run alongside it and the row has one timing slot. It records the model and effort each one asked for. TTFT is the wait from the step's start to its first output: a chunk of text, thinking, a tool call, or its input. TPS is the step's output tokens per second from that output to its stop. While a step runs, the band redraws ten times a second: it shows how long the step has run, and a light moves across the word working./tokens opens a pane with tokens per day by model, for the last 7 days, the last 30 days, or all time, with the context in use and the heatmap. On the desktop app hooks/pane.tsx draws the pane; the terminal draws it in hooks/register.tsx. It runs hooks/scan_usage.py with Python 3 over the transcripts in $CLAUDE_CONFIG_DIR/projects, or in ~/.claude/projects when that variable is unset or empty. The script parses each transcript line, but keeps only each response's usage counts, model and timestamp. It prints the tokens per day by model and per local hour, and for each range how many sessions had usage in it, with a sub-agent's usage counted under the session that spawned it. It sends nothing anywhere..claude-plugin/: plugin.json, and marketplace.json, which the install line above readsbin/install.js, package.json: an installer that runs the install line above through the Claude Code CLI, and its npm metadatadocs/*.svg: the illustrations above; the numbers in the tokens pane are example datadocs/gen-visuals.mjs: draws those illustrations, with node docs/gen-visuals.mjsdocs/desktop-band.json, docs/desktop-pane.json: the element trees the desktop images are drawn fromdocs/render-desktop.mjs: draws the desktop images, with node docs/render-desktop.mjshooks/register.tsx: hooks, the speed row and the card above the prompt in the terminal, with the quota and the context, the toasts, and the terminal's /tokens panehooks/band.tsx: the band on the desktop app, with the speed and the quota on one row, the quota as solid barshooks/pane.tsx: the /tokens pane on the desktop app, with solid columns, a bar per model, and the heatmaphooks/alerts.ts: the 90% toasts, and the time a limit has left at its pacehooks/context.ts: the groups of the context bar, its runs and the legend's lines, and the tokens pane's legendhooks/timing.ts: the speed row's text, the TTFT and TPS arithmetic, the step state, and the light's positionhooks/format.ts: bar, tone, reset-label and time-left, token-count, cost and text-clipping helpershooks/tokens.ts: the /tokens chart, heatmap and summary helpershooks/scan_usage.py: counts tokens per day, model and local hour, and sessions per range, from the transcriptshooks/*.test.ts, hooks/test_scan_usage.py: teststypes/index.d.ts: the quota, context, speed and token types, and the plugin state declarationTested with Claude Code 2.1.299.
hooks/register.tsx 581 lines1import type { Register } from 'claude-code'
2import { atom, read, update } from 'claude-code'
3
4import type { ContextFill, ContextRow, ModelInUse, ModelSpeed, ModelTokens, QuotaWindow, TokenRange, TokenScan, TokenScanState } from '../types'
5
6import { BAR_WIDTH, barCells, clip, compactTokens, filledCells, formatCost, labelOf, resetIn, resetsThatFit, toneOf } from './format'
7import { LEGEND_SPLIT, contextBar, contextLegend, packLegend, shareOf } from './context'
8import type { BarRun } from './context'
9import { desktopBand } from './band'
10import { desktopPane } from './pane'
11import { contextAlert, limitAlert, minutesToFull, passed } from './alerts'
12import { FRAME_MS, WORKING, applyStep, speedLine, sweepIndex } from './timing'
13import {
14 CHART_ROWS,
15 axisLabels,
16 chartRows,
17 colorOf,
18 columnsWithSegments,
19 dayLabel,
20 daysInRange,
21 formatShare,
22 formatTokens,
23 heatCell,
24 hourGrid,
25 modelName,
26 rankEntries,
27 sumModels,
28 tokensOf,
29 WEEKDAYS,
30} from './tokens'
31
32const windows = atom(
33 { plugin: 'odometer', key: 'windows' } as const,
34 [] as QuotaWindow[],
35)
36
37const context = atom(
38 { plugin: 'odometer', key: 'context' } as const,
39 null as ContextFill | null,
40)
41
42const model = atom(
43 { plugin: 'odometer', key: 'model' } as const,
44 null as ModelInUse | null,
45)
46
47const cost = atom(
48 { plugin: 'odometer', key: 'cost' } as const,
49 null as number | null,
50)
51
52const contextRows = atom(
53 { plugin: 'odometer', key: 'contextRows' } as const,
54 null as ContextRow[] | null,
55)
56
57const windowsAt = atom(
58 { plugin: 'odometer', key: 'windowsAt' } as const,
59 null as number | null,
60)
61
62const tokens = atom(
63 { plugin: 'odometer', key: 'tokens' } as const,
64 { status: 'idle' } as TokenScanState,
65)
66
67const range = atom(
68 { plugin: 'odometer', key: 'range' } as const,
69 'week' as TokenRange,
70)
71
72const timing = atom(
73 { plugin: 'odometer', key: 'timing' } as const,
74 null as ModelSpeed | null,
75)
76
77// Counts the frames drawn while a step runs. The light's place on the word comes from it,
78// and the band reads it, so each frame redraws the band alone.
79const sweep = atom(
80 { plugin: 'odometer', key: 'sweep' } as const,
81 0,
82)
83
84const PANE = 'tokens'
85// The context card is not drawn narrower than this, once its border and padding are taken off the band.
86const CARD_MIN_INNER = 20
87
88/** The chunks that mean the model has begun to answer; the stop and the engine's own do not. */
89const OUTPUT = new Set<string>(['text', 'thinking', 'tool', 'input'])
90
91const RANGES: ReadonlyArray<{ key: TokenRange; label: string }> = [
92 { key: 'all', label: 'All time' },
93 { key: 'week', label: 'Last 7 days' },
94 { key: 'month', label: 'Last 30 days' },
95]
96
97// `python3` is the name on macOS and Linux, and Windows usually has only `python`.
98// A candidate passes when it answers `--version` as Python 3: a missing command,
99// a Windows stub that exits non-zero, or an older Python 2 fails the probe.
100async function pythonFor(
101 run: (argv: string[]) => Promise<{ exitCode: number; stdout: string; stderr: string }>,
102): Promise<string | undefined> {
103 for (const name of ['python3', 'python']) {
104 const probe = await run([name, '--version']).catch(() => undefined)
105 if (probe?.exitCode === 0 && /Python 3\./.test(`${probe.stdout}${probe.stderr}`)) return name
106 }
107 return undefined
108}
109
110/** The rows of a context breakdown, as the state keeps them. */
111function rowsOf(breakdown: { categories: ContextRow[] } | undefined): ContextRow[] | null {
112 return breakdown ? breakdown.categories.map(({ name, tokens, kind }) => ({ name, tokens, kind })) : null
113}
114
115export const register: Register = on => {
116 on('session.start', async ($, e, next) => {
117 const startedAt = await $.clock.now()
118 const reading = await $.session.usage({ breakdown: 'summary' })
119 await update($, windows, () => reading.rateLimits)
120 await update($, windowsAt, () => startedAt)
121 await update($, context, () => reading.context)
122 await update($, contextRows, () => rowsOf(reading.context.breakdown))
123 await update($, cost, () => reading.cost?.usd ?? null)
124 // A new session starts with no model in use and no speed to show, not the last session's.
125 await update($, model, () => null)
126 await update($, timing, () => null)
127 // Runs at once when typed mid-turn: it reads the transcripts on disk, not the turn's state.
128 await $.command.register({
129 name: 'tokens',
130 description: 'Show tokens per day, by model, in a pane',
131 immediate: true,
132 })
133
134 return next(e)
135 })
136
137 // Pushed by the engine when a window moves a whole point or the context fill moves, so the
138 // line refreshes without polling.
139 on('session.measure', async ($, e, next) => {
140 const before = await read($, windows)
141 const beforeAt = await read($, windowsAt)
142 const fillBefore = await read($, context)
143 const at = await $.clock.now()
144 await update($, windows, () => e.rateLimits)
145 await update($, windowsAt, () => at)
146 await update($, context, () => e.context)
147 await update($, cost, () => e.cost?.usd ?? null)
148 // The measure never carries the breakdown, so a change of the fill asks for it.
149 if (e.changed.includes('context')) {
150 const reading = await $.session.usage({ breakdown: 'summary' })
151 await update($, contextRows, () => rowsOf(reading.context.breakdown))
152 }
153 // A limit or the context that has just passed the alert line raises one toast. A limit's toast says how long
154 // it has left at the pace it has been filling.
155 for (const window of e.rateLimits) {
156 const previous = before.find(w => w.kind === window.kind)
157 if (previous && passed(previous.percentUsed, window.percentUsed)) {
158 const minutes =
159 beforeAt === null
160 ? undefined
161 : minutesToFull({ percent: previous.percentUsed, at: beforeAt }, { percent: window.percentUsed, at })
162 $.ui.toast(limitAlert(window, minutes, new Date(at)), { timeoutMs: 8000 })
163 }
164 }
165 if (e.context.percent !== undefined && passed(fillBefore?.percent, e.context.percent)) {
166 $.ui.toast(contextAlert(e.context.percent), { timeoutMs: 8000 })
167 }
168
169 return next(e)
170 })
171
172 // Times each model step of the main conversation. A step starts when its stream does; its
173 // time to first output is the wait for its first chunk of text, thinking, a tool call or its
174 // input; and its stop carries the output tokens. The steps pass on unchanged. A sub-agent's
175 // steps pass on untimed: sub-agents can run alongside the main conversation and each other,
176 // and the row has one timing slot, so their steps would overwrite each other's readings.
177 on('turn.step', async function* ($, e, next) {
178 if (e.agentId) return yield* next(e)
179
180 const startedAt = await $.clock.now()
181 await update($, timing, speed => applyStep(speed, { kind: 'start', at: startedAt }))
182 await update($, model, () => ({ model: e.model, effort: e.effort === undefined ? undefined : String(e.effort) }))
183 // Each frame, the band redraws: the elapsed seconds count up and the light moves on.
184 const tick = $.clock.every(FRAME_MS, () => {
185 update($, sweep, frames => (frames ?? 0) + 1).catch(() => undefined)
186 })
187
188 let answered = false
189 try {
190 for await (const chunk of next(e)) {
191 if (!answered && OUTPUT.has(chunk.kind)) {
192 answered = true
193 const at = await $.clock.now()
194 await update($, timing, speed => applyStep(speed, { kind: 'output', at }))
195 }
196 if (chunk.kind === 'stop') {
197 const at = await $.clock.now()
198 const outputTokens = chunk.usage?.output_tokens ?? 0
199 await update($, timing, speed => applyStep(speed, { kind: 'stop', at, outputTokens }))
200 }
201 yield chunk
202 }
203 } finally {
204 tick.cancel()
205 await update($, timing, speed => applyStep(speed, { kind: 'end' }))
206 }
207 })
208
209 // Opens the pane first, then runs the scanner the mod ships. Only per-day
210 // token counts and session ids come back; no message text is kept.
211 on('command.run', { command: 'tokens' }, async $ => {
212 await $.ui.open({ id: PANE, title: 'Tokens per day' })
213 await update($, tokens, () => ({ status: 'scanning' as const }))
214 try {
215 const python = await pythonFor(argv => $.process.run(argv, { timeoutMs: 10_000 }))
216 if (!python) throw new Error('Python 3 was not found on the PATH, as python3 or python')
217 const ran = await $.process.run(
218 [python, '-I', `${$.plugin.root}/hooks/scan_usage.py`],
219 { timeoutMs: 120_000 },
220 )
221 // The reply is cut at 4 MiB; a cut reply is not valid JSON, so say why instead.
222 if (ran.isStdoutTruncated) throw new Error('The scan printed more than 4 MiB, too much to read')
223 if (ran.exitCode === 0) {
224 const scan = JSON.parse(ran.stdout) as TokenScan
225 await update($, tokens, () => ({ status: 'ready' as const, scan }))
226 } else {
227 const reason = ran.stderr.trim().split('\n')[0] || 'the scanner exited with an error'
228 await update($, tokens, () => ({ status: 'failed' as const, reason }))
229 }
230 } catch (error) {
231 const reason = error instanceof Error ? error.message : String(error)
232 await update($, tokens, () => ({ status: 'failed' as const, reason }))
233 }
234
235 return { text: 'Tokens pane updated.' }
236 })
237
238 // Draws the quota on one row of the band directly above the prompt, the model's speed on
239 // the row beneath it, and the context window as a card at the foot of the band, nearest
240 // the prompt. The band is shared with surveys, so it yields while one holds it. It sizes
241 // to bodyColumns, which keeps clear of the band's own [-] mark.
242 on('ui.render', { component: 'AbovePrompt' }, async ($, e, next) => {
243 if (e.props.hasSurvey) return next(e)
244
245 // One round trip for every state read the band needs, since the band redraws ten times a second while a step runs.
246 const [rows, speed, nowMs, frames, fill, modelInUse, spend, ctxRows] = await Promise.all([
247 read($, windows),
248 read($, timing),
249 $.clock.now(),
250 read($, sweep),
251 read($, context),
252 read($, model),
253 read($, cost),
254 read($, contextRows),
255 ])
256 const now = new Date(nowMs)
257 const { Box, Text } = $.ui.resolve(e)
258 const roomy = e.props.bodyColumns >= 105
259 const withReset = e.props.bodyColumns >= 97
260 const barWidth = e.props.bodyColumns >= 90 ? BAR_WIDTH : 6
261 const running = speed?.running ?? null
262 const line = speedLine(running, speed?.ttftMs, speed?.tps, nowMs)
263 const lit = running ? sweepIndex(frames * FRAME_MS) : undefined
264 // On the desktop app the band has its own drawing: the speed and the quota on one row, the quota as solid bars.
265 // The context is left to the desktop's own panel.
266 if (e.surface === 'desktop') {
267 return desktopBand(
268 {
269 now,
270 windows: rows,
271 model: e.props.bodyColumns >= 90 ? modelInUse : null,
272 cost: e.props.bodyColumns >= 100 ? spend : null,
273 speed: line,
274 running: running !== null,
275 lit,
276 },
277 { Box, Text },
278 )
279 }
280 // The card is the band's width less its border and padding. The fill is absent until the session's
281 // first response, and again after a compaction: then the card shows a dash and an empty bar.
282 const inner = e.props.bodyColumns - 4
283 const withCard = inner >= CARD_MIN_INNER
284 const breakdown = ctxRows ?? []
285 // Before the first response the engine reports no fill, but the breakdown the session starts with already counts the
286 // tokens in use. The fill is worked out from it then, so the card shows its parts at once.
287 const usedTokens = breakdown.reduce((sum, row) => (row.kind === 'used' ? sum + row.tokens : sum), 0)
288 const estimated = fill !== null && fill.window > 0 && usedTokens > 0 ? Math.round((usedTokens / fill.window) * 100) : null
289 const ctxPercent = fill?.percent === undefined ? estimated : Math.round(fill.percent)
290 const ctxTone = ctxPercent === null ? null : toneOf(ctxPercent)
291 // The fill alone, when there is no part of the window to draw: a dash before the first response, else filled cells.
292 const fillBar: BarRun[] = ctxPercent === null || ctxTone === null
293 ? [{ color: 'subtle', glyph: '─', cells: inner }]
294 : [
295 { color: 'claude', glyph: '█', cells: Math.min(inner, filledCells(ctxPercent, inner)) },
296 { color: 'subtle', glyph: '─', cells: Math.max(0, inner - filledCells(ctxPercent, inner)) },
297 ]
298 // The parts of the window, once the breakdown has tokens to show: an all-zero breakdown would leave the bar empty.
299 const rowBar: BarRun[] = ctxPercent === null ? [] : contextBar(breakdown, inner)
300 const bar: BarRun[] = rowBar.length > 0 ? rowBar : fillBar
301 // The legend sits under the bar, which the terminal draws as text.
302 const legendLines = rowBar.length > 0 ? packLegend(contextLegend(breakdown), fill?.window ?? 0, inner) : []
303 // The tokens against the window: the last response's, or the breakdown's until a response reports them.
304 const shownTokens = fill?.tokens ?? (estimated === null ? undefined : usedTokens)
305 const tokensText = fill === null || shownTokens === undefined ? undefined : `${compactTokens(shownTokens)} of ${compactTokens(fill.window)}`
306 const withModel = e.props.bodyColumns >= 90
307 const withCost = e.props.bodyColumns >= 100
308
309 // The quota is drawn as the context is below it: a diamond heading, then one line with each window's bar,
310 // badge and reset time.
311 // A window keeps its reset time while the quota line fits the card; the last resets go first.
312 const windowParts = rows.map(w => ({
313 label: labelOf(w.kind),
314 badge: ` ${Math.round(w.percentUsed)}% `,
315 reset: withReset ? resetIn(w.resetsAt, now) : '',
316 }))
317 const resetShown = resetsThatFit(windowParts, inner, barWidth, roomy)
318 const quotaHeader = (
319 <Box flexDirection="row">
320 <Text color="claude">{'◆ '}</Text>
321 <Text bold>quota</Text>
322 </Box>
323 )
324 const quotaWindows = (
325 <Box flexDirection="row">
326 {rows.length === 0 ? (
327 <Text color="inactive">no data yet</Text>
328 ) : (
329 rows.map((w, i) => {
330 const percent = Math.round(w.percentUsed)
331 const tone = toneOf(percent)
332 const cells = barCells(percent, barWidth)
333 const reset = resetIn(w.resetsAt, now)
334
335 return (
336 <Box key={w.kind} flexDirection="row">
337 {i === 0 ? null : <Text color="inactive">{roomy ? ' · ' : ' · '}</Text>}
338 <Text color="inactive">{`${labelOf(w.kind)} `}</Text>
339 <Text color="claude">{cells.filled}</Text>
340 <Text color="subtle">{cells.empty}</Text>
341 <Text bold color={tone}>{` ${percent}% `}</Text>
342 {resetShown[i] && reset ? <Text color="inactive">{roomy ? ` ↻ ${reset}` : ` ↻ ${reset}`}</Text> : null}
343 </Box>
344 )
345 })
346 )}
347 </Box>
348 )
349 const quotaRow = (
350 <Box flexDirection="column">
351 {quotaHeader}
352 {quotaWindows}
353 </Box>
354 )
355
356 // The speed row sits above the card: the model in use, the light while a step runs, its speeds and the cost.
357 const speedRow = (
358 <Box flexDirection="row">
359 <Text color="inactive">{' '}</Text>
360 {withModel && modelInUse !== null ? (
361 <Box flexDirection="row">
362 <Text color="claude">{clip(modelName(modelInUse.model), 18)}</Text>
363 <Text color="inactive">{modelInUse.effort === undefined ? ' · ' : ` (${modelInUse.effort}) · `}</Text>
364 </Box>
365 ) : null}
366 {running ? (
367 [...WORKING].map((letter, i) => (
368 <Text key={`letter-${i}`} color={i === lit ? 'claude' : 'inactive'} bold={i === lit}>
369 {letter}
370 </Text>
371 ))
372 ) : null}
373 <Text color="inactive">{running ? line.slice(WORKING.length) : line}</Text>
374 {withCost && spend !== null ? <Text color="inactive">{` · ${formatCost(spend)}`}</Text> : null}
375 </Box>
376 )
377
378 return (
379 <Box flexDirection="column" marginTop={1}>
380 {speedRow}
381 {withCard ? (
382 <Box flexDirection="column" borderStyle="round" borderColor="inactive" paddingX={1}>
383 {quotaRow}
384 <Box flexDirection="row" justifyContent="space-between">
385 <Text wrap="truncate-end">
386 <Text color="claude">{'◆ '}</Text>
387 <Text bold>context</Text>
388 </Text>
389 {ctxPercent === null || ctxTone === null ? (
390 <Text dimColor>{fill === null ? '—' : `— of ${compactTokens(fill.window)}`}</Text>
391 ) : (
392 <Text wrap="truncate-start">
393 {tokensText === undefined ? null : <Text dimColor>{`${tokensText} `}</Text>}
394 <Text bold color={ctxTone}>{` ${ctxPercent}% `}</Text>
395 </Text>
396 )}
397 </Box>
398 {ctxPercent === null ? (
399 <Text dimColor wrap="truncate-end">{'the parts appear after the first response'}</Text>
400 ) : (
401 <Text>
402 {bar.map((run, index) => (
403 <Text key={`bar-${index}`} color={run.color}>{run.glyph.repeat(run.cells)}</Text>
404 ))}
405 </Text>
406 )}
407 {legendLines.map((items, row) => (
408 <Text key={`legend-${row}`} wrap="truncate-end">
409 {items.map((item, index) => (
410 <Text key={item.label}>
411 {index > 0 ? LEGEND_SPLIT : null}
412 <Text color={item.color}>{`${item.glyph} `}</Text>
413 <Text dimColor>{`${item.label} `}</Text>
414 <Text bold>{compactTokens(item.tokens)}</Text>
415 <Text dimColor>{` ${shareOf(item.tokens, fill?.window ?? 0)}`}</Text>
416 </Text>
417 ))}
418 </Text>
419 ))}
420 </Box>
421 ) : (
422 quotaRow
423 )}
424 </Box>
425 )
426 })
427
428 on('ui.render', { component: 'Pane', requestId: PANE }, async ($, e) => {
429 const { Box, Button, Text } = $.ui.resolve(e)
430 const state = await read($, tokens)
431 const selected = await read($, range)
432 const ctxNow = await read($, context)
433 const ctxRowsNow = await read($, contextRows)
434 const now = new Date(await $.clock.now())
435 const columns = e.viewport?.columns ?? 80
436
437 const scan = state.status === 'ready' ? state.scan : undefined
438 const days = scan ? daysInRange(selected, now, scan) : []
439 const totals: Record<string, ModelTokens> = scan ? sumModels(scan, days) : {}
440 const entries = rankEntries(totals)
441 const order = entries.map(([id]) => id)
442 const grand = entries.reduce((sum, [, t]) => sum + tokensOf(t), 0)
443 const sessions = scan ? scan.sessions[selected] : 0
444 const anyUsage = scan ? Object.keys(scan.days).length > 0 : false
445 const hours = scan ? hourGrid(scan, days) : []
446 const hourMax = Math.max(0, ...hours.flat())
447 const maxColumns = Math.max(4, Math.min(60, Math.floor((columns - 12) / 2)))
448 const bars = scan ? columnsWithSegments(scan, days, order, maxColumns) : []
449 const max = Math.max(1, ...bars.map(bar => bar.total))
450 const grid = chartRows(bars, max)
451 const [topLabel, middleLabel, bottomLabel] = axisLabels(max)
452 const axis = (row: number): string => {
453 if (row === 0) return topLabel
454 if (row === Math.floor(CHART_ROWS / 2)) return middleLabel
455 if (row === CHART_ROWS - 1) return bottomLabel
456 return ''
457 }
458
459 // On the desktop app the pane has its own drawing: solid bars and cells, with the figures in larger type.
460 if (e.surface === 'desktop') {
461 return desktopPane(
462 {
463 columns,
464 state,
465 selected,
466 ranges: RANGES,
467 onSelect: async key => {
468 await update($, range, () => key)
469 },
470 context: ctxNow,
471 breakdown: ctxRowsNow ?? [],
472 days,
473 entries,
474 grand,
475 sessions,
476 anyUsage,
477 hours,
478 hourMax,
479 bars,
480 max,
481 },
482 { Box, Button, Text },
483 )
484 }
485
486 return (
487 <Box flexDirection="column">
488 {ctxNow === null || ctxNow.tokens === undefined ? null : (
489 <Box flexDirection="column" marginBottom={1}>
490 <Text bold>{`Context now: ${compactTokens(ctxNow.tokens)} of ${compactTokens(ctxNow.window)}`}</Text>
491 <Box flexDirection="row">
492 {contextLegend(ctxRowsNow ?? []).map(item => (
493 <Text key={item.label} color={item.color}>{`${item.glyph} ${item.label} ${compactTokens(item.tokens)} `}</Text>
494 ))}
495 </Box>
496 </Box>
497 )}
498 <Box flexDirection="row">
499 {RANGES.map(item => (
500 <Button
501 key={item.key}
502 variant={item.key === selected ? 'primary' : 'secondary'}
503 onPress={() => update($, range, () => item.key)}
504 >
505 {item.label}
506 </Button>
507 ))}
508 </Box>
509 {state.status === 'idle' || state.status === 'scanning' ? (
510 <Text dimColor>Scanning transcripts…</Text>
511 ) : null}
512 {state.status === 'failed' ? (
513 <Text color="error">{`Could not read the transcripts: ${state.reason}`}</Text>
514 ) : null}
515 {scan && grand === 0 && anyUsage ? <Text color="inactive">No tokens in this range.</Text> : null}
516 {scan && grand === 0 && !anyUsage ? (
517 <Text color="inactive">{`No transcripts with usage found in ${scan.root}.`}</Text>
518 ) : null}
519 {scan && grand > 0 ? (
520 <Box flexDirection="column">
521 {grid.map((line, row) => (
522 <Box key={`row-${row}`} flexDirection="row">
523 <Text color="inactive">{`${axis(row).padStart(7)} │ `}</Text>
524 {line.map((cell, col) => (
525 <Text key={`col-${col}`} color={cell.color}>{`${cell.char} `}</Text>
526 ))}
527 </Box>
528 ))}
529 <Text color="inactive">{`${' '.repeat(7)} └${'─'.repeat(bars.length * 2)}`}</Text>
530 <Text color="inactive">
531 {`${' '.repeat(10)}${dayLabel(days[0] ?? '')} … ${dayLabel(days[days.length - 1] ?? '')}`}
532 </Text>
533 <Box flexDirection="row">
534 {entries.map(([id]) => (
535 <Text key={id} color={colorOf(id)}>{`■ ${modelName(id)} `}</Text>
536 ))}
537 </Box>
538 {entries.map(([id, t]) => {
539 const share = (tokensOf(t) / grand) * 100
540 return (
541 <Box key={id} flexDirection="column">
542 <Box flexDirection="row">
543 <Text color={colorOf(id)}>{'● '}</Text>
544 <Text bold>{modelName(id)}</Text>
545 <Text color="inactive">{` (${formatShare(share)})`}</Text>
546 </Box>
547 <Text color="inactive">{` In: ${formatTokens(t.input)} · Out: ${formatTokens(t.output)}`}</Text>
548 <Text color="inactive">{` Cache: ${formatTokens(t.cacheRead)} read · ${formatTokens(t.cacheWrite)} write`}</Text>
549 </Box>
550 )
551 })}
552 <Text color="inactive">
553 {`${formatTokens(grand)} tokens across ${sessions} ${sessions === 1 ? 'session' : 'sessions'}. Each API response is counted once; /stats adds every log row.`}
554 </Text>
555 <Box flexDirection="column" marginTop={1}>
556 <Text bold>{'When tokens are used, by hour (local time)'}</Text>
557 <Text color="inactive">
558 {` ${Array.from({ length: 24 }, (_, hour) => (hour % 3 === 0 ? String(hour).padEnd(2) : ' ')).join('')}`}
559 </Text>
560 {WEEKDAYS.map((name, row) => (
561 <Box key={name} flexDirection="row">
562 <Text color="inactive">{`${name} `}</Text>
563 {(hours[row] ?? []).map((value, hour) => {
564 const cell = heatCell(value, hourMax)
565 return (
566 <Text key={`hour-${hour}`} color={cell.color}>
567 {`${cell.char} `}
568 </Text>
569 )
570 })}
571 </Box>
572 ))}
573 <Text color="inactive">{' less ░▒▓█ more'}</Text>
574 </Box>
575 </Box>
576 ) : null}
577 </Box>
578 )
579 })
580}
581hooks/format.ts 104 lines1export const BAR_WIDTH = 10
2
3const LABELS: Record<string, string> = {
4 five_hour: '5h',
5 seven_day: '7d',
6 spend_limit: 'spend',
7}
8
9const DAYS = ['Sun', 'Mon', 'Tue', 'Wed', 'Thu', 'Fri', 'Sat']
10
11export type Tone = 'success' | 'warning' | 'error'
12
13/** Short label for a window kind, e.g. `five_hour` to `5h`. */
14export function labelOf(kind: string): string {
15 return LABELS[kind] ?? clip(kind, 8)
16}
17
18/** Green under 70%, amber from 70%, red from 90%. */
19export function toneOf(percent: number): Tone {
20 if (percent >= 90) return 'error'
21 if (percent >= 70) return 'warning'
22 return 'success'
23}
24
25
26/** How many of the bar's cells are filled for a percentage. */
27export function filledCells(percent: number, width = BAR_WIDTH): number {
28 const clamped = Math.min(100, Math.max(0, percent))
29 const cells = Math.round((clamped / 100) * width)
30
31 // Any usage shows at least one cell, so 1% does not draw as an empty bar.
32 return clamped > 0 ? Math.max(1, cells) : 0
33}
34
35/** The filled and empty runs of the bar, ready to draw in two colors. */
36export function barCells(percent: number, width = BAR_WIDTH) {
37 const filled = filledCells(percent, width)
38 return { filled: '█'.repeat(filled), empty: '─'.repeat(width - filled) }
39}
40
41/** `14:20` when the reset is today, `Mon 14:00` otherwise. Empty when unknown. */
42export function resetLabel(resetsAt: string | undefined, now: Date): string {
43 if (!resetsAt) return ''
44 const at = new Date(resetsAt)
45 if (Number.isNaN(at.getTime())) return ''
46
47 const time = `${pad(at.getHours())}:${pad(at.getMinutes())}`
48 const isToday = at.toDateString() === now.toDateString()
49 return isToday ? time : `${DAYS[at.getDay()]} ${time}`
50}
51
52/** How long until the reset: `6h 20m`, `45m`, or `1d 21h` from a day away. Empty when unknown, `0m` once it has passed. */
53export function resetIn(resetsAt: string | undefined, now: Date): string {
54 if (!resetsAt) return ''
55 const at = new Date(resetsAt)
56 if (Number.isNaN(at.getTime())) return ''
57
58 const minutes = Math.max(0, Math.floor((at.getTime() - now.getTime()) / 60_000))
59 const days = Math.floor(minutes / 1440)
60 const hours = Math.floor((minutes % 1440) / 60)
61 const rest = minutes % 60
62 if (days > 0) return `${days}d ${hours}h`
63 if (hours > 0) return `${hours}h ${rest}m`
64 return `${rest}m`
65}
66
67/**
68 * Which windows of the quota line keep their reset time. A window takes its label, bar, badge and, while shown, its
69 * reset, with a gap between windows; the line may be `width` cells at most, so the last resets go first until it fits.
70 */
71export function resetsThatFit(windows: { label: string; badge: string; reset: string }[], width: number, barWidth: number, roomy: boolean): boolean[] {
72 const shown = windows.map(window => window.reset !== '')
73 const lineWidth = (): number =>
74 windows.reduce((sum, window, index) => {
75 const gap = index === 0 ? 0 : roomy ? 7 : 3
76 const reset = shown[index] ? (roomy ? 4 : 3) + window.reset.length : 0
77 return sum + gap + window.label.length + 1 + barWidth + window.badge.length + reset
78 }, 0)
79 for (let index = windows.length - 1; index >= 0 && lineWidth() > width; index--) shown[index] = false
80 return shown
81}
82
83/** `364`, `92k`, `1.2M`: a token count in few enough characters to sit on the quota row. */
84export function compactTokens(count: number): string {
85 if (count >= 999_500) return `${(count / 1e6).toFixed(1)}M`
86 if (count >= 1e3) return `${Math.round(count / 1e3)}k`
87 return String(Math.round(count))
88}
89
90/** `$1.24`; a spend under a cent reads as `<$0.01`. */
91export function formatCost(usd: number): string {
92 if (usd > 0 && usd < 0.01) return '<$0.01'
93 return `$${usd.toFixed(2)}`
94}
95
96/** Cuts text to `max` characters, ending with an ellipsis when it is cut. */
97export function clip(text: string, max: number): string {
98 return text.length <= max ? text : `${text.slice(0, max - 1)}…`
99}
100
101function pad(n: number): string {
102 return String(n).padStart(2, '0')
103}
104hooks/context.ts 149 lines1import type { ContextRow } from '../types'
2
3import { compactTokens } from './format'
4
5/** The groups the context bar is split into, each with its colour and the label the tokens pane gives it. */
6export const CONTEXT_GROUPS = [
7 { key: 'system', label: 'System', color: '#3987e5' },
8 { key: 'tools', label: 'Tools', color: '#8e6fd8' },
9 { key: 'memory', label: 'Memory', color: '#2aa198' },
10 { key: 'messages', label: 'Messages', color: '#d56aa0' },
11 { key: 'other', label: 'Other', color: '#898781' },
12] as const
13
14export type ContextGroup = (typeof CONTEXT_GROUPS)[number]['key']
15
16/** The buffer auto-compaction keeps back and the free space: the parts of the window that no group holds. */
17const BUFFER = { label: 'Buffer', glyph: '░', color: 'inactive' }
18const FREE = { label: 'Free', glyph: '─', color: 'subtle' }
19/** The glyph of a group in use. */
20const USED_GLYPH = '█'
21/** The gap between two items of a legend line. */
22export const LEGEND_SPLIT = ' '
23
24/** The group of a used row, by its name as /context prints it. */
25export function groupOf(name: string): ContextGroup {
26 if (/system prompt/i.test(name)) return 'system'
27 if (/tool/i.test(name)) return 'tools'
28 if (/memory|skill|command/i.test(name)) return 'memory'
29 if (/message/i.test(name)) return 'messages'
30 return 'other'
31}
32
33/** The tokens of the used rows, summed by group. Free, buffer and deferred rows are left out. */
34function usedByGroup(rows: ContextRow[]): Map<ContextGroup, number> {
35 const totals = new Map<ContextGroup, number>()
36 for (const row of rows) {
37 if (row.kind !== 'used') continue
38 const key = groupOf(row.name)
39 totals.set(key, (totals.get(key) ?? 0) + row.tokens)
40 }
41 return totals
42}
43
44/** The tokens of the rows of one kind, summed. */
45function sumKind(rows: ContextRow[], kind: ContextRow['kind']): number {
46 return rows.filter(row => row.kind === kind).reduce((sum, row) => sum + row.tokens, 0)
47}
48
49/**
50 * Shares `cells` among the weights in proportion to them, so the parts add up to `cells`. Ties go to the
51 * earlier weight, and a weight of zero gets no cell.
52 */
53export function allocateCells(cells: number, weights: number[]): number[] {
54 const total = weights.reduce((sum, weight) => sum + weight, 0)
55 if (cells <= 0 || total <= 0) return weights.map(() => 0)
56 const exact = weights.map(weight => (weight / total) * cells)
57 const parts = exact.map(value => Math.floor(value))
58 let left = cells - parts.reduce((sum, part) => sum + part, 0)
59 const byRest = exact
60 .map((value, index) => ({ index, rest: value - Math.floor(value) }))
61 .sort((a, b) => b.rest - a.rest || a.index - b.index)
62 for (const { index } of byRest) {
63 if (left <= 0) break
64 if ((weights[index] ?? 0) > 0) {
65 parts[index] = (parts[index] ?? 0) + 1
66 left -= 1
67 }
68 }
69 return parts
70}
71
72/** One part of the bar: `cells` copies of `glyph`, in `color`. */
73export type BarRun = { color: string; glyph: string; cells: number }
74
75/**
76 * The window as one bar of `width` cells, from left to right: each group in use in its colour, then the buffer,
77 * then the free space. A group in use gets at least one cell, taken from the largest part when rounding leaves none.
78 */
79export function contextBar(rows: ContextRow[], width: number): BarRun[] {
80 const totals = usedByGroup(rows)
81 const parts = [
82 ...CONTEXT_GROUPS.map(group => ({ label: group.label, color: group.color, glyph: USED_GLYPH, tokens: totals.get(group.key) ?? 0, used: true })),
83 { ...BUFFER, tokens: sumKind(rows, 'buffer'), used: false },
84 { ...FREE, tokens: sumKind(rows, 'free'), used: false },
85 ].filter(part => part.tokens > 0)
86 const cells = allocateCells(width, parts.map(part => part.tokens))
87 parts.forEach((part, index) => {
88 if (!part.used || (cells[index] ?? 0) > 0) return
89 const donor = cells.indexOf(Math.max(...cells))
90 if ((cells[donor] ?? 0) > 1) {
91 cells[donor] = (cells[donor] ?? 0) - 1
92 cells[index] = 1
93 }
94 })
95 return parts
96 .map((part, index) => ({ color: part.color, glyph: part.glyph, cells: cells[index] ?? 0 }))
97 .filter(run => run.cells > 0)
98}
99
100/** One item of the legend: a group, the buffer, or the free space, with its glyph, its colour and its tokens. */
101export type LegendItem = { label: string; glyph: string; color: string; tokens: number }
102
103/** What the legend lists: each group in use, the buffer when it holds tokens, then the free space. */
104export function contextLegend(rows: ContextRow[]): LegendItem[] {
105 const totals = usedByGroup(rows)
106 const groups = CONTEXT_GROUPS.filter(group => (totals.get(group.key) ?? 0) > 0).map(group => ({
107 label: group.label,
108 glyph: '■',
109 color: group.color,
110 tokens: totals.get(group.key) ?? 0,
111 }))
112 const buffer = sumKind(rows, 'buffer')
113 return [
114 ...groups,
115 ...(buffer > 0 ? [{ ...BUFFER, tokens: buffer }] : []),
116 { ...FREE, tokens: sumKind(rows, 'free') },
117 ]
118}
119
120/** A share of the window as a whole percent, or `<1%` for tokens that are under one percent of it. */
121export function shareOf(tokens: number, window: number): string {
122 const percent = window > 0 ? (tokens / window) * 100 : 0
123 if (percent > 0 && percent < 1) return '<1%'
124 return `${Math.round(percent)}%`
125}
126
127/** One legend item as the legend writes it, e.g. `■ System 10k 5%`: the width `packLegend` fits it into a line. */
128export function legendText(item: LegendItem, window: number): string {
129 return `${item.glyph} ${item.label} ${compactTokens(item.tokens)} ${shareOf(item.tokens, window)}`
130}
131
132/** The legend packed into lines no wider than `width`: an item that would overflow starts the next line. */
133export function packLegend(items: LegendItem[], window: number, width: number): LegendItem[][] {
134 const lines: LegendItem[][] = []
135 let used = 0
136 for (const item of items) {
137 const size = legendText(item, window).length
138 const last = lines[lines.length - 1]
139 if (last !== undefined && used + LEGEND_SPLIT.length + size <= width) {
140 last.push(item)
141 used += LEGEND_SPLIT.length + size
142 } else {
143 lines.push([item])
144 used = size
145 }
146 }
147 return lines
148}
149hooks/band.tsx 108 lines1import type { BoxProps, ElementConstructor, TextProps } from 'claude-code'
2
3import type { ModelInUse, QuotaWindow } from '../types'
4
5import { BAR_WIDTH, clip, filledCells, formatCost, labelOf, resetLabel, toneOf } from './format'
6import { WORKING } from './timing'
7import { modelName } from './tokens'
8
9/** The elements the desktop band is drawn with: the desktop table's Box and Text. */
10export type BandElements = {
11 Box: ElementConstructor<BoxProps>
12 Text: ElementConstructor<TextProps>
13}
14
15/** What the desktop band shows, as the render hook reads it from the plugin's state. */
16export type BandView = {
17 now: Date
18 windows: QuotaWindow[]
19 model: ModelInUse | null
20 cost: number | null
21 /** The speed row's text, starting with the word `working` while a step runs. */
22 speed: string
23 running: boolean
24 /** The letter of `working` the light is on, if it is on the word. */
25 lit: number | undefined
26}
27
28/** The part of a quota bar that is not used. */
29const TRACK = 'subtle'
30
31/** One quota window: its label, a solid bar, its percentage in bold, and its reset time. */
32function quotaWindow(w: QuotaWindow, now: Date, { Box, Text }: BandElements) {
33 const percent = Math.round(w.percentUsed)
34 const tone = toneOf(percent)
35 const filled = filledCells(percent, BAR_WIDTH)
36 const reset = resetLabel(w.resetsAt, now)
37 return (
38 <Box key={w.kind} flexDirection="row" alignItems="center" columnGap={1}>
39 <Text size="caption" color="inactive">{labelOf(w.kind)}</Text>
40 <Box flexDirection="row" width={BAR_WIDTH} height={1}>
41 {filled > 0 ? <Box width={filled} height={1} backgroundColor="claude" /> : null}
42 {BAR_WIDTH > filled ? <Box width={BAR_WIDTH - filled} height={1} backgroundColor={TRACK} /> : null}
43 </Box>
44 <Text size="body" weight="semibold" tabular color={tone}>{`${percent}%`}</Text>
45 {reset ? <Text size="caption" color="inactive" tabular>{`↻ ${reset}`}</Text> : null}
46 </Box>
47 )
48}
49
50/** The quota: one item per window, in a row. */
51function quotaRow(view: BandView, els: BandElements) {
52 const { Box, Text } = els
53 if (view.windows.length === 0) return <Text size="caption" color="inactive">no data yet</Text>
54 return (
55 <Box flexDirection="row" alignItems="center" columnGap={3}>
56 {view.windows.map(w => quotaWindow(w, view.now, els))}
57 </Box>
58 )
59}
60
61/** The speed items: the model in use, the light while a step runs, the speeds, and the session's cost. */
62function speedItems(view: BandView, { Box, Text }: BandElements) {
63 return (
64 <Box flexDirection="row" alignItems="flex-end" columnGap={2}>
65 {view.model === null ? null : (
66 <Box flexDirection="row" alignItems="flex-end" columnGap={1}>
67 <Text size="caption" weight="semibold" color="claude">{clip(modelName(view.model.model), 18)}</Text>
68 {view.model.effort === undefined ? null : <Text size="caption" color="inactive">{`(${view.model.effort})`}</Text>}
69 </Box>
70 )}
71 {view.running ? (
72 <Box flexDirection="row">
73 {[...WORKING].map((letter, index) => (
74 <Text
75 key={`letter-${index}`}
76 size="caption"
77 color={index === view.lit ? 'claude' : 'inactive'}
78 weight={index === view.lit ? 'semibold' : 'regular'}
79 >
80 {letter}
81 </Text>
82 ))}
83 </Box>
84 ) : null}
85 <Text size="caption" color="inactive" tabular>
86 {view.running ? view.speed.slice(WORKING.length).trimStart() : view.speed}
87 </Text>
88 {view.cost === null ? null : <Text size="caption" color="inactive" tabular>{formatCost(view.cost)}</Text>}
89 </Box>
90 )
91}
92
93/**
94 * The band on the desktop app: one row, with the speed on the left and the quota on the right, and no card around
95 * them. When the band is too narrow for both, the quota moves to a row of its own. The terminal draws the band as
96 * text, in register.tsx.
97 */
98export function desktopBand(view: BandView, els: BandElements) {
99 const { Box } = els
100 return (
101 <Box flexDirection="row" flexWrap="wrap" alignItems="center" columnGap={3} rowGap={1} marginTop={1} paddingX={2}>
102 {speedItems(view, els)}
103 <Box flexGrow={1} />
104 {quotaRow(view, els)}
105 </Box>
106 )
107}
108hooks/pane.tsx 280 lines1import type { BoxProps, ButtonProps, ElementConstructor, TextProps } from 'claude-code'
2
3import type { ContextFill, ContextRow, ModelTokens, TokenRange, TokenScanState } from '../types'
4
5import type { LegendItem } from './context'
6import { contextLegend, shareOf } from './context'
7import { compactTokens, toneOf } from './format'
8import type { Column } from './tokens'
9import { CHART_ROWS, WEEKDAYS, axisLabels, colorOf, dayLabel, formatShare, formatTokens, modelName, tokensOf } from './tokens'
10
11/** The elements the desktop pane is drawn with: the desktop table's Box, Button and Text. */
12export type PaneElements = {
13 Box: ElementConstructor<BoxProps>
14 Button: ElementConstructor<ButtonProps>
15 Text: ElementConstructor<TextProps>
16}
17
18/** What the desktop pane shows, as the render hook has read and computed it. */
19export type PaneView = {
20 /** The pane's width in cells. */
21 columns: number
22 state: TokenScanState
23 selected: TokenRange
24 ranges: ReadonlyArray<{ key: TokenRange; label: string }>
25 onSelect: (range: TokenRange) => Promise<void>
26 context: ContextFill | null
27 breakdown: ContextRow[]
28 /** The days the chart and the heatmap cover, oldest first. */
29 days: string[]
30 /** The models with their tokens over the range, most used first. */
31 entries: Array<[string, ModelTokens]>
32 grand: number
33 sessions: number
34 anyUsage: boolean
35 /** Tokens per weekday (Monday first) and local hour, and the largest of them. */
36 hours: number[][]
37 hourMax: number
38 /** One column per group of days, and the largest column's total. */
39 bars: Column[]
40 max: number
41}
42
43/** The chart is six rows tall, a little shorter than the terminal's, to keep the pane compact. */
44const CHART_HEIGHT = 6
45/** A day with usage is at least this share of the largest day, so a light day does not draw as a gap. */
46const MIN_DAY = 1 / (CHART_ROWS * 8)
47/** The unfilled part of a bar. */
48const TRACK = 'subtle'
49/** The heatmap's colours: four steps of the Claude colour, from the faintest to the full colour. */
50const HEAT = ['#d7775740', '#d7775780', '#d77757bf', '#d77757'] as const
51/** A heatmap cell that holds no tokens. */
52const HEAT_NONE = 'subtle'
53/** The flex weights of a bar's parts sum to this: the engine takes no weight above 10000. */
54const WHOLE = 1000
55
56/** The colour of a heatmap cell: a step by its share of the largest cell. */
57function heatColor(value: number, max: number): string {
58 if (value <= 0 || max <= 0) return HEAT_NONE
59 const level = Math.min(4, Math.ceil((value / max) * 4))
60 return HEAT[level - 1] ?? HEAT_NONE
61}
62
63/** The legend's items in a row, wrapping when the pane is narrow. */
64function legendRow(items: LegendItem[], window: number, { Box, Text }: PaneElements) {
65 return (
66 <Box flexDirection="row" flexWrap="wrap" columnGap={3}>
67 {items.map(item => (
68 <Text key={item.label} size="caption">
69 <Text color={item.color}>{'■ '}</Text>
70 <Text color="inactive">{`${item.label} `}</Text>
71 <Text tabular>{compactTokens(item.tokens)}</Text>
72 <Text color="inactive">{` ${shareOf(item.tokens, window)}`}</Text>
73 </Text>
74 ))}
75 </Box>
76 )
77}
78
79/** The context in use now: its tokens against the window, one bar of its parts, and the legend under it. */
80function contextNow(context: ContextFill | null, breakdown: ContextRow[], els: PaneElements) {
81 const { Box, Text } = els
82 if (context === null || context.tokens === undefined) return null
83 const legend = contextLegend(breakdown)
84 const percent = context.percent === undefined ? null : Math.round(context.percent)
85 const withParts = legend.some(item => item.tokens > 0)
86 // Each part's share of the bar is its tokens, so the bar needs no count of cells.
87 const total = legend.reduce((sum, item) => sum + item.tokens, 0)
88 const filled = percent === null ? 0 : Math.min(100, Math.max(0, percent))
89 const segments = withParts
90 ? legend.map(item => ({ color: item.color, weight: (item.tokens / total) * WHOLE }))
91 : percent === null
92 ? []
93 : [
94 { color: toneOf(percent), weight: (filled / 100) * WHOLE },
95 { color: TRACK, weight: ((100 - filled) / 100) * WHOLE },
96 ]
97 return (
98 <Box flexDirection="column" gap={1}>
99 <Box flexDirection="row" justifyContent="space-between" alignItems="flex-end">
100 <Text size="footnote" weight="semibold">
101 <Text color="claude">{'◆ '}</Text>
102 {'Context now'}
103 </Text>
104 <Text size="caption" color="inactive" tabular>
105 {`${compactTokens(context.tokens)} of ${compactTokens(context.window)}`}
106 </Text>
107 </Box>
108 <Box flexDirection="row">
109 {segments
110 .filter(segment => segment.weight > 0)
111 .map((segment, index) => (
112 <Box key={`part-${index}`} flexGrow={segment.weight} height={1} backgroundColor={segment.color} />
113 ))}
114 </Box>
115 {withParts ? legendRow(legend, context.window, els) : null}
116 </Box>
117 )
118}
119
120/** The range's total, in large type, with the sessions it spans. */
121function totals(view: PaneView, { Box, Text }: PaneElements) {
122 return (
123 <Box flexDirection="column" gap={1}>
124 <Box flexDirection="row" alignItems="flex-end" columnGap={2}>
125 <Text size="heading" weight="semibold" tabular>{formatTokens(view.grand)}</Text>
126 <Text size="caption" color="inactive">
127 {`tokens across ${view.sessions} ${view.sessions === 1 ? 'session' : 'sessions'}`}
128 </Text>
129 </Box>
130 <Text size="caption" color="inactive">Each API response is counted once; /stats adds every log row.</Text>
131 </Box>
132 )
133}
134
135/**
136 * One day's column of the chart: its models stacked from the bottom, each as tall as its tokens. The column is
137 * as tall as the largest day, so the empty part above it is the rest of that height.
138 */
139function dayColumn(bar: Column, max: number, index: number, { Box }: PaneElements) {
140 const shown = bar.total > 0 ? Math.max(bar.total, max * MIN_DAY) : 0
141 const scale = bar.total > 0 ? shown / bar.total : 0
142 return (
143 <Box key={`day-${index}`} flexDirection="column" flexGrow={1}>
144 <Box flexGrow={((max - shown) / max) * WHOLE} />
145 {[...bar.segments].reverse().map(segment => (
146 <Box
147 key={segment.model}
148 flexGrow={((segment.tokens * scale) / max) * WHOLE}
149 backgroundColor={colorOf(segment.model)}
150 />
151 ))}
152 </Box>
153 )
154}
155
156/** The tokens per day, as solid columns with the axis labels beside them and the first and last days under them. */
157function chart(view: PaneView, els: PaneElements) {
158 const { Box, Text } = els
159 const [top, middle, bottom] = axisLabels(view.max)
160 return (
161 <Box flexDirection="column" gap={1}>
162 <Box flexDirection="row" columnGap={2} height={CHART_HEIGHT}>
163 <Box flexDirection="column" justifyContent="space-between">
164 <Text size="caption" color="inactive" tabular>{top}</Text>
165 <Text size="caption" color="inactive" tabular>{middle}</Text>
166 <Text size="caption" color="inactive" tabular>{bottom}</Text>
167 </Box>
168 <Box flexDirection="row" flexGrow={1} columnGap={1}>
169 {view.bars.map((bar, index) => dayColumn(bar, view.max, index, els))}
170 </Box>
171 </Box>
172 <Box flexDirection="row" justifyContent="space-between">
173 <Text size="caption" color="inactive">{dayLabel(view.days[0] ?? '')}</Text>
174 <Text size="caption" color="inactive">{dayLabel(view.days[view.days.length - 1] ?? '')}</Text>
175 </Box>
176 </Box>
177 )
178}
179
180/** Each model: its colour, its name and share, a bar of that share, and its input, output and cache tokens. */
181function modelRows(view: PaneView, { Box, Text }: PaneElements) {
182 return (
183 <Box flexDirection="column" gap={1}>
184 {view.entries.map(([id, tokens]) => {
185 const share = (tokensOf(tokens) / view.grand) * 100
186 return (
187 <Box key={id} flexDirection="column" gap={1}>
188 <Box flexDirection="row" alignItems="center" columnGap={2}>
189 <Box width={1} height={1} backgroundColor={colorOf(id)} />
190 <Text weight="semibold">{modelName(id)}</Text>
191 <Box flexGrow={1} />
192 <Text size="caption" color="inactive" tabular>{`${formatShare(share)} · ${formatTokens(tokensOf(tokens))}`}</Text>
193 </Box>
194 <Box flexDirection="row" height={1}>
195 <Box flexGrow={share} height={1} backgroundColor={colorOf(id)} />
196 <Box flexGrow={100 - share} height={1} backgroundColor={TRACK} />
197 </Box>
198 <Text size="caption" color="inactive" tabular>
199 {`In ${formatTokens(tokens.input)} · Out ${formatTokens(tokens.output)} · Cache ${formatTokens(tokens.cacheRead)} read, ${formatTokens(tokens.cacheWrite)} write`}
200 </Text>
201 </Box>
202 )
203 })}
204 </Box>
205 )
206}
207
208/** The heatmap: a solid cell for each weekday and hour, the hours labelled every third, and a key under it. */
209function heatmap(view: PaneView, { Box, Text }: PaneElements) {
210 return (
211 <Box flexDirection="column" gap={1}>
212 <Text size="footnote" weight="semibold">When tokens are used, by hour (local time)</Text>
213 <Box flexDirection="row" columnGap={1}>
214 <Box width={4} />
215 {Array.from({ length: 24 }, (_, hour) => (
216 <Box key={`hour-${hour}`} flexGrow={1} overflow="visible">
217 {hour % 3 === 0 ? <Text size="caption" color="inactive">{String(hour)}</Text> : null}
218 </Box>
219 ))}
220 </Box>
221 {WEEKDAYS.map((name, row) => (
222 <Box key={name} flexDirection="row" alignItems="center" columnGap={1}>
223 <Box width={4}>
224 <Text size="caption" color="inactive">{name}</Text>
225 </Box>
226 {(view.hours[row] ?? []).map((value, hour) => (
227 <Box key={`hour-${hour}`} flexGrow={1} height={1} backgroundColor={heatColor(value, view.hourMax)} />
228 ))}
229 </Box>
230 ))}
231 <Box flexDirection="row" alignItems="center" columnGap={1}>
232 <Text size="caption" color="inactive">less</Text>
233 {[HEAT_NONE, ...HEAT].map((color, index) => (
234 <Box key={`key-${index}`} width={2} height={1} backgroundColor={color} />
235 ))}
236 <Text size="caption" color="inactive">more</Text>
237 </Box>
238 </Box>
239 )
240}
241
242/**
243 * The /tokens pane on the desktop app: the context in use, the range buttons, the range's total, solid columns per day,
244 * a bar per model, and the heatmap of hours. The terminal draws the same pane as text, in register.tsx.
245 */
246export function desktopPane(view: PaneView, els: PaneElements) {
247 const { Box, Button, Text } = els
248 const { state } = view
249 return (
250 <Box flexDirection="column" gap={1}>
251 {contextNow(view.context, view.breakdown, els)}
252 <Box flexDirection="row" columnGap={1}>
253 {view.ranges.map(item => (
254 <Button
255 key={item.key}
256 variant={item.key === view.selected ? 'primary' : 'secondary'}
257 onPress={() => view.onSelect(item.key)}
258 >
259 {item.label}
260 </Button>
261 ))}
262 </Box>
263 {state.status === 'idle' || state.status === 'scanning' ? <Text dimColor>Scanning transcripts…</Text> : null}
264 {state.status === 'failed' ? <Text color="error">{`Could not read the transcripts: ${state.reason}`}</Text> : null}
265 {state.status === 'ready' && view.grand === 0 && view.anyUsage ? <Text color="inactive">No tokens in this range.</Text> : null}
266 {state.status === 'ready' && view.grand === 0 && !view.anyUsage ? (
267 <Text color="inactive">{`No transcripts with usage found in ${state.scan.root}.`}</Text>
268 ) : null}
269 {state.status === 'ready' && view.grand > 0 ? (
270 <Box flexDirection="column" gap={1}>
271 {totals(view, els)}
272 {chart(view, els)}
273 {modelRows(view, els)}
274 {heatmap(view, els)}
275 </Box>
276 ) : null}
277 </Box>
278 )
279}
280hooks/alerts.ts 41 lines1import type { QuotaWindow } from '../types'
2
3import { labelOf, resetLabel } from './format'
4
5/** A limit or the context that passes this percentage raises a toast, once per crossing. */
6export const ALERT_AT = 90
7
8/** Whether a reading passed the alert line since the one before it. */
9export function passed(previous: number | undefined, percent: number): boolean {
10 return previous !== undefined && previous < ALERT_AT && percent >= ALERT_AT
11}
12
13/** Minutes until 100%, at the pace between two readings; undefined when the limit is not filling. */
14export function minutesToFull(
15 previous: { percent: number; at: number },
16 now: { percent: number; at: number },
17): number | undefined {
18 const minutes = (now.at - previous.at) / 60_000
19 const rise = now.percent - previous.percent
20 if (minutes <= 0 || rise <= 0) return undefined
21 return (100 - now.percent) / (rise / minutes)
22}
23
24/** `about 2 min`, or `about 1h 30m` for a longer span. */
25export function spanText(minutes: number): string {
26 const whole = Math.max(1, Math.round(minutes))
27 return whole < 60 ? `about ${whole} min` : `about ${Math.floor(whole / 60)}h ${whole % 60}m`
28}
29
30/** The toast for a limit that passed the alert line: its share, the time left at its pace, and its reset. */
31export function limitAlert(window: QuotaWindow, minutes: number | undefined, now: Date): string {
32 const pace = minutes === undefined ? '' : `, ${spanText(minutes)} to 100% at this pace`
33 const reset = resetLabel(window.resetsAt, now)
34 return `${labelOf(window.kind)} at ${Math.round(window.percentUsed)}%${pace}${reset ? `, resets ${reset}` : ''}`
35}
36
37/** The toast for the context that passed the alert line. */
38export function contextAlert(percent: number): string {
39 return `Context at ${Math.round(percent)}%: consider /compact soon`
40}
41hooks/timing.ts 98 lines1import type { ModelSpeed } from '../types'
2
3/** The word the speed row shows while a step runs. */
4export const WORKING = 'working'
5
6/** How often the band redraws while a step runs: ten times a second. */
7export const FRAME_MS = 100
8
9/** `850ms` under a second, then `1.2s`. */
10export function formatTtft(ms: number): string {
11 return ms < 1000 ? `${Math.round(ms)}ms` : `${(ms / 1000).toFixed(1)}s`
12}
13
14/** `42 tok/s`. */
15export function formatTps(tps: number): string {
16 return `${Math.round(tps)} tok/s`
17}
18
19/** `12s`: whole seconds since a step started. */
20export function formatElapsed(ms: number): string {
21 return `${Math.max(0, Math.floor(ms / 1000))}s`
22}
23
24/**
25 * Output tokens per second over a model step: from its first output to its stop.
26 * Absent when the step wrote no output, or the stretch is under half a second, too
27 * short to read a rate from.
28 */
29export function tpsOf(outputTokens: number, firstOutputAt: number, stoppedAt: number): number | undefined {
30 const seconds = (stoppedAt - firstOutputAt) / 1000
31 if (outputTokens <= 0 || seconds < 0.5) return undefined
32 return outputTokens / seconds
33}
34
35/**
36 * The speed row's text. While a step runs it shows the time the step has taken, its
37 * time to first output once that has come, and the last output speed. Between steps
38 * it shows the latest time to first output and output speed.
39 */
40export function speedLine(
41 running: { startedAt: number; firstOutputAt: number } | null,
42 ttftMs: number | undefined,
43 tps: number | undefined,
44 nowMs: number,
45): string {
46 const tpsText = tps === undefined ? '—' : formatTps(tps)
47 if (running) {
48 const ttftText = running.firstOutputAt > 0 && ttftMs !== undefined ? formatTtft(ttftMs) : '…'
49 return `${WORKING} ${formatElapsed(nowMs - running.startedAt)} · TTFT ${ttftText} · last TPS ${tpsText}`
50 }
51 const ttftText = ttftMs === undefined ? '—' : formatTtft(ttftMs)
52 return `TTFT ${ttftText} · TPS ${tpsText}`
53}
54
55/**
56 * Which letter of `WORKING` the light sits on at `nowMs`, or undefined while it is off
57 * the word. The light crosses the word once per `periodMs`, entering just before the
58 * first letter and leaving just after the last.
59 */
60export function sweepIndex(nowMs: number, periodMs = 1500): number | undefined {
61 const step = ((nowMs % periodMs) * (WORKING.length + 2)) / periodMs
62 const index = Math.floor(step) - 1
63 return index >= 0 && index < WORKING.length ? index : undefined
64}
65
66/** What a model step's stream reports, in order: it starts, its first output comes, it stops, or the stream ends. */
67export type StepEvent =
68 | { kind: 'start'; at: number }
69 | { kind: 'output'; at: number }
70 | { kind: 'stop'; at: number; outputTokens: number }
71 | { kind: 'end' }
72
73/**
74 * The speed state after one of a step's events. The time to first output is set at the
75 * step's first output. Its output speed is set when it stops; a step with no output keeps
76 * the speed the step before it measured. An output with no step running changes nothing.
77 */
78export function applyStep(speed: ModelSpeed | null, event: StepEvent): ModelSpeed {
79 const prev: ModelSpeed = speed ?? { running: null }
80 switch (event.kind) {
81 case 'start':
82 return { ...prev, running: { startedAt: event.at, firstOutputAt: 0 } }
83 case 'output': {
84 const running = prev.running
85 if (!running || running.firstOutputAt > 0) return prev
86 return { ...prev, running: { ...running, firstOutputAt: event.at }, ttftMs: event.at - running.startedAt }
87 }
88 case 'stop': {
89 const running = prev.running
90 const tps =
91 running && running.firstOutputAt > 0 ? tpsOf(event.outputTokens, running.firstOutputAt, event.at) : undefined
92 return { ...prev, running: null, tps: tps ?? prev.tps }
93 }
94 case 'end':
95 return { ...prev, running: null }
96 }
97}
98hooks/tokens.ts 230 lines1import type { ModelTokens, TokenRange, TokenScan } from '../types'
2
3/** Rows the chart draws; each row is eight levels tall. */
4export const CHART_ROWS = 8
5
6const LEVELS = [' ', '▁', '▂', '▃', '▄', '▅', '▆', '▇', '█']
7const MONTHS = ['Jan', 'Feb', 'Mar', 'Apr', 'May', 'Jun', 'Jul', 'Aug', 'Sep', 'Oct', 'Nov', 'Dec']
8/** `claude-<family>-<major>-<minor>`, with or without a `-YYYYMMDD` snapshot date. */
9const MODEL_ID = /^claude-(opus|sonnet|haiku)-(\d+)(?:-(\d+))?(?:-\d{8})?$/
10/** The older order, `claude-<major>-<minor>-<family>`, with the same optional date. */
11const OLDER_MODEL_ID = /^claude-(\d+)(?:-(\d+))?-(opus|sonnet|haiku)(?:-\d{8})?$/
12const NONE: ModelTokens = { input: 0, output: 0, cacheRead: 0, cacheWrite: 0 }
13
14/** A color for a chart mark: one of the model colors below, or a theme key for a model it does not know. */
15export type ChartColor = string
16
17/** One column of the chart: a day, or several days when the range is long. */
18export type Column = {
19 label: string
20 total: number
21 segments: Array<{ model: string; tokens: number }>
22}
23
24/** One cell of the chart: a level character in a color; an empty cell is a blank. */
25export type Cell = { char: string; color: ChartColor }
26
27/** `claude-<family>-<major>-<minor>` reads as `<Family> <major>.<minor>`; an id it does not know reads as it is. */
28export function modelName(id: string): string {
29 const recent = MODEL_ID.exec(id)
30 if (recent) {
31 const [, family = '', major = '', minor] = recent
32 return nameOf(family, major, minor)
33 }
34 const older = OLDER_MODEL_ID.exec(id)
35 if (!older) return id
36 const [, major = '', minor, family = ''] = older
37 return nameOf(family, major, minor)
38}
39
40/** `Family 5.5`, or `Family 3` when the id names no minor version. */
41function nameOf(family: string, major: string, minor?: string): string {
42 const name = `${family.charAt(0).toUpperCase()}${family.slice(1)} ${major}`
43 return minor ? `${name}.${minor}` : name
44}
45
46// Categorical slots 2, 1 and 3 of the reference palette, dark steps. Together they pass the
47// palette check on both the light and the dark surface. The theme's own tones do not: its
48// dark ones are too pale for three series to stay apart, and its status tones are reserved
49// for the quota.
50const MODEL_COLORS = { opus: '#d95926', sonnet: '#3987e5', haiku: '#199e70' } as const
51
52/** Opus, Sonnet and Haiku each have a color; any other model is drawn in the theme's inactive tone. */
53export function colorOf(id: string): ChartColor {
54 if (id.includes('opus')) return MODEL_COLORS.opus
55 if (id.includes('sonnet')) return MODEL_COLORS.sonnet
56 if (id.includes('haiku')) return MODEL_COLORS.haiku
57 return 'inactive'
58}
59
60/** `1.8B`, `230.5M`, `3.5k`, `364`. */
61export function formatTokens(count: number): string {
62 if (count >= 1e9) return `${(count / 1e9).toFixed(1)}B`
63 if (count >= 1e6) return `${(count / 1e6).toFixed(1)}M`
64 if (count >= 1e3) return `${(count / 1e3).toFixed(1)}k`
65 return String(Math.round(count))
66}
67
68/** `99.3%`. */
69export function formatShare(percent: number): string {
70 return `${percent.toFixed(1)}%`
71}
72
73/** Every token a model used: input, output, and both cache counts. */
74export function tokensOf(tokens: ModelTokens): number {
75 return tokens.input + tokens.output + tokens.cacheRead + tokens.cacheWrite
76}
77
78/** `Oct 8`, from a `YYYY-MM-DD` day key. */
79export function dayLabel(key: string): string {
80 const [, month = '1', day = '1'] = key.split('-')
81 return `${MONTHS[Number(month) - 1] ?? month} ${Number(day)}`
82}
83
84/** The local day as a `YYYY-MM-DD` key. */
85export function dayKey(date: Date): string {
86 const month = String(date.getMonth() + 1).padStart(2, '0')
87 const day = String(date.getDate()).padStart(2, '0')
88 return `${date.getFullYear()}-${month}-${day}`
89}
90
91function dayOf(key: string): Date {
92 const [year = '1970', month = '1', day = '1'] = key.split('-')
93 return new Date(Number(year), Number(month) - 1, Number(day))
94}
95
96/**
97 * The days a range covers, oldest first, ending today. `all` starts at the
98 * first day the scan has, so the chart spans every day with usage.
99 */
100export function daysInRange(range: TokenRange, today: Date, scan: TokenScan): string[] {
101 const end = new Date(today.getFullYear(), today.getMonth(), today.getDate())
102 if (range !== 'all') {
103 const length = range === 'week' ? 7 : 30
104 return Array.from({ length }, (_, i) =>
105 dayKey(new Date(end.getFullYear(), end.getMonth(), end.getDate() - (length - 1 - i))),
106 )
107 }
108 const first = Object.keys(scan.days).sort()[0]
109 const days: string[] = []
110 const start = first ? dayOf(first) : end
111 for (let day = start; day <= end; day = new Date(day.getFullYear(), day.getMonth(), day.getDate() + 1)) {
112 days.push(dayKey(day))
113 }
114 return days.length > 0 ? days : [dayKey(end)]
115}
116
117/** Splits days into runs of equal length, at most `maxColumns` of them. */
118export function columnsOf(days: string[], maxColumns: number): string[][] {
119 const size = Math.max(1, Math.ceil(days.length / Math.max(1, maxColumns)))
120 const groups: string[][] = []
121 for (let i = 0; i < days.length; i += size) groups.push(days.slice(i, i + size))
122 return groups
123}
124
125/** Each model's tokens over some days, summed. */
126export function sumModels(scan: TokenScan, days: string[]): Record<string, ModelTokens> {
127 const sums: Record<string, ModelTokens> = {}
128 for (const day of days) {
129 const models: Record<string, ModelTokens> = scan.days[day] ?? {}
130 for (const [id, tokens] of Object.entries(models)) {
131 const sum = (sums[id] ??= { input: 0, output: 0, cacheRead: 0, cacheWrite: 0 })
132 sum.input += tokens.input
133 sum.output += tokens.output
134 sum.cacheRead += tokens.cacheRead
135 sum.cacheWrite += tokens.cacheWrite
136 }
137 }
138 return sums
139}
140
141/** The models with their totals, most used first. A model with no tokens in the range is left out. */
142export function rankEntries(totals: Record<string, ModelTokens>): Array<[string, ModelTokens]> {
143 return Object.entries(totals)
144 .filter(([, tokens]) => tokensOf(tokens) > 0)
145 .sort(([, a], [, b]) => tokensOf(b) - tokensOf(a))
146}
147
148/** One column per group of days, each with its models in the order given. */
149export function columnsWithSegments(
150 scan: TokenScan,
151 days: string[],
152 order: string[],
153 maxColumns: number,
154): Column[] {
155 return columnsOf(days, maxColumns).map(group => {
156 const sums = sumModels(scan, group)
157 const segments = order.map(model => ({ model, tokens: tokensOf(sums[model] ?? NONE) }))
158 const total = segments.reduce((sum, segment) => sum + segment.tokens, 0)
159 return { label: group[0] ?? '', total, segments }
160 })
161}
162
163/**
164 * The chart as rows from the top down. Each column is as tall as its share of
165 * the largest column, and at least one level when it has any tokens; its models
166 * stack from the bottom in the order given, and a cell takes the color of the
167 * model at its top.
168 */
169export function chartRows(columns: Column[], max: number, rows = CHART_ROWS): Cell[][] {
170 const levels = rows * 8
171 const heights = columns.map(column => {
172 if (max <= 0 || column.total <= 0) return 0
173 // Any usage shows at least one level, so a light day does not draw as a gap.
174 return Math.max(1, Math.round((column.total / max) * levels))
175 })
176 const grid: Cell[][] = []
177 for (let row = rows - 1; row >= 0; row--) {
178 grid.push(
179 columns.map((column, i) => {
180 const height = heights[i] ?? 0
181 const base = row * 8
182 const fill = Math.min(8, Math.max(0, height - base))
183 if (fill === 0) return { char: ' ', color: 'inactive' }
184
185 const top = base + fill - 1
186 let color: ChartColor = 'inactive'
187 let cumulative = 0
188 for (const segment of column.segments) {
189 cumulative += segment.tokens
190 color = colorOf(segment.model)
191 if (top < Math.round((cumulative / column.total) * height)) break
192 }
193 return { char: LEVELS[fill] ?? '█', color }
194 }),
195 )
196 }
197 return grid
198}
199
200/** The top, middle and bottom labels of the vertical axis. */
201export function axisLabels(max: number): [string, string, string] {
202 return [formatTokens(max), formatTokens(max / 2), '0']
203}
204
205/** The days of the week, Monday first: the rows of the usage heatmap. */
206export const WEEKDAYS = ['Mon', 'Tue', 'Wed', 'Thu', 'Fri', 'Sat', 'Sun']
207
208/** Tokens per weekday (Monday first) and local hour, summed over the days given. */
209export function hourGrid(scan: TokenScan, days: string[]): number[][] {
210 const grid = WEEKDAYS.map(() => Array.from({ length: 24 }, () => 0))
211 for (const day of days) {
212 const counts = scan.hours?.[day]
213 const row = grid[(dayOf(day).getDay() + 6) % 7]
214 if (!counts || !row) continue
215 counts.forEach((tokens, hour) => {
216 row[hour] = (row[hour] ?? 0) + tokens
217 })
218 }
219 return grid
220}
221
222const SHADES = ['·', '░', '▒', '▓', '█']
223
224/** One heatmap cell: a shade by its share of the largest cell, and a dot when it holds nothing. */
225export function heatCell(value: number, max: number): { char: string; color: string } {
226 if (value <= 0 || max <= 0) return { char: SHADES[0] ?? '·', color: 'subtle' }
227 const level = Math.min(4, Math.ceil((value / max) * 4))
228 return { char: SHADES[level] ?? '█', color: 'claude' }
229}
230types/index.d.ts 104 lines1/** One rate-limit window as the engine reports it: `five_hour`, `seven_day`, or `spend_limit`. */
2export type QuotaWindow = {
3 kind: string
4 /** How much of the window is used, 0 to 100 (past 100 on an exceeded spend limit). */
5 percentUsed: number
6 /** When the window resets, as an ISO 8601 timestamp. */
7 resetsAt?: string
8}
9
10/** Tokens one model used: input, output, and the cache reads and writes, each response counted once. */
11export type ModelTokens = {
12 input: number
13 output: number
14 cacheRead: number
15 cacheWrite: number
16}
17
18/**
19 * What the transcript scan found: the projects folder it read, how many sessions had usage in each range, and each
20 * model's tokens per local day (YYYY-MM-DD).
21 */
22export type TokenScan = {
23 root: string
24 sessions: Record<TokenRange, number>
25 days: Record<string, Record<string, ModelTokens>>
26 /** The tokens of each local day (YYYY-MM-DD) by local hour: 24 counts, from midnight. */
27 hours: Record<string, number[]>
28}
29
30/** The `/tokens` pane's scan: waiting, running, then the result or why it failed. */
31export type TokenScanState =
32 | { status: 'idle' }
33 | { status: 'scanning' }
34 | { status: 'ready'; scan: TokenScan }
35 | { status: 'failed'; reason: string }
36
37/** The span the `/tokens` pane charts. */
38export type TokenRange = 'week' | 'month' | 'all'
39
40/** A model step that has started and not yet stopped: when it started, and when its first output came (0 until it does). */
41export type RunningStep = {
42 startedAt: number
43 firstOutputAt: number
44}
45
46/** How fast the model answers: the step running now, its latest time to first output, and its latest output speed. */
47export type ModelSpeed = {
48 /** The step running now; null between steps. */
49 running: RunningStep | null
50 /** Milliseconds from a step's start to its first output, for the latest step that had output. */
51 ttftMs?: number
52 /** Output tokens per second, for the latest step that measured one; kept until the next step does. */
53 tps?: number
54}
55
56/**
57 * The live context window: its size in tokens, and its fill once a response of the window has reported one.
58 * The fill is absent in a fresh session, and after a compaction until the next response.
59 */
60export type ContextFill = {
61 /** Input tokens the last response was answered over, once the window has reported them. */
62 tokens?: number
63 /** The context window's size, in tokens. */
64 window: number
65 /** The fill as a whole percentage, once a response of the window has reported one. */
66 percent?: number
67}
68
69/** The model the latest main-conversation step asked for, and the effort it was given, when its model has one. */
70export type ModelInUse = {
71 model: string
72 effort?: string
73}
74
75/** One row of the context breakdown: its name as /context prints it, its estimated tokens, and what it is. */
76export type ContextRow = {
77 name: string
78 tokens: number
79 kind: 'used' | 'free' | 'buffer' | 'deferred'
80}
81
82declare module 'claude-code' {
83 interface PluginState {
84 'odometer': {
85 windows: QuotaWindow[]
86 tokens: TokenScanState
87 range: TokenRange
88 timing: ModelSpeed | null
89 /** Frames drawn while a model step runs; the light on the word `working` moves with it. */
90 sweep: number
91 /** The live context window, shown at the end of the quota row. */
92 context: ContextFill | null
93 /** The model the latest main-conversation step asked for, shown at the start of the speed row. */
94 model: ModelInUse | null
95 /** The session's cost in US dollars, shown at the end of the speed row. */
96 cost: number | null
97 /** The rows of the live context breakdown, which colour the bar and fill the tokens pane's legend. */
98 contextRows: ContextRow[] | null
99 /** When the rate-limit windows were last read, in milliseconds: the pace of a limit is taken from it. */
100 windowsAt: number | null
101 }
102 }
103}
104