token-weather
A live forecast of the context window, drawn above the prompt: a weather icon, the fill percentage, and a chart of the last turns. Patched to share the band…
newband

A live forecast of the context window, drawn above the prompt: a weather icon, the fill percentage, and a chart of the last turns. Patched to share the band…
Changed in this copy: the original draws its line above the prompt and stops there, so any mod that runs after it in the chain cannot draw in that band. This copy draws its line and passes the band on, so other mods (such as context-handoff) show below it. Nothing else is changed. Original: anthropics/claude-code-playground, Apache License 2.0.
A Claude Code mod that draws a live forecast of your context window in the band above the prompt. We're sharing it as the smallest of the three mods here: one hooks module that reads real usage figures and draws one line of UI.
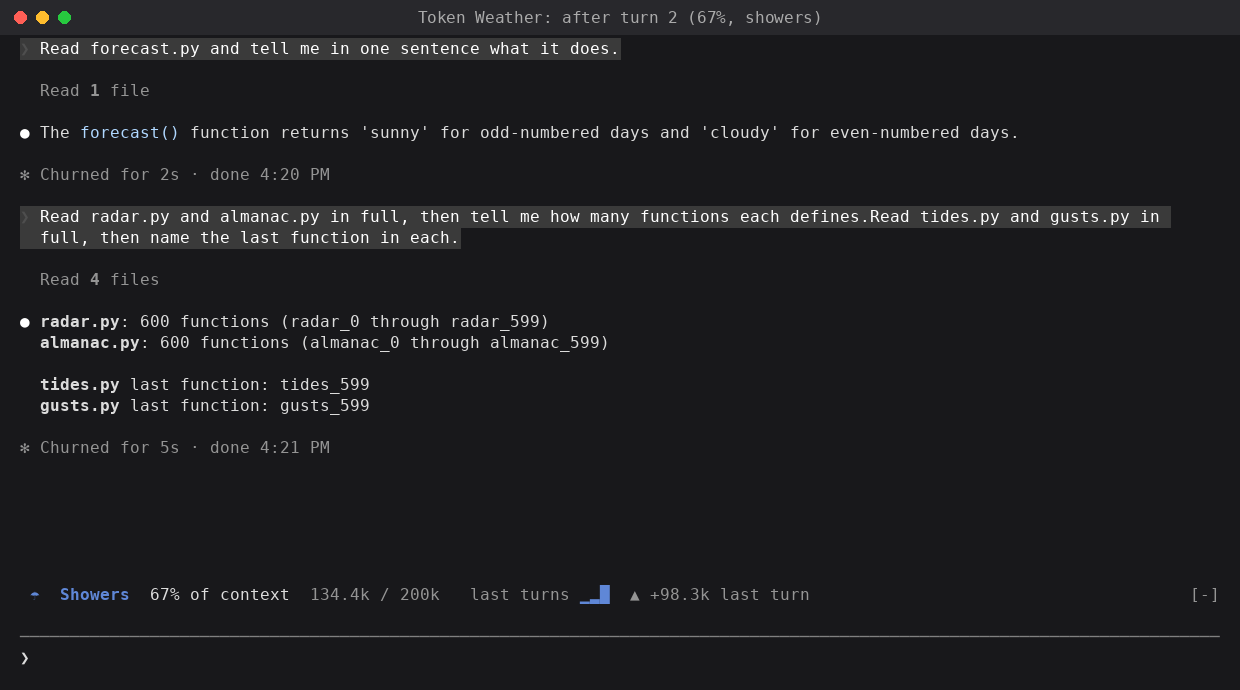
☂ Showers 67% of context 134.4k / 200k last turns ▁▂█ ▲ +98.3k last turnAfter each turn, the band shows:
| Used | Forecast |
|---|---|
| under 25% | ☀ Clear |
| 25–49% | ☁ Cloudy |
| 50–74% | ☂ Showers |
| 75–89% | ☇ Storm |
| 90% up | ↯ Compact soon |
The numbers are real, not estimated. After each main-loop turn, the mod calls $.session.usage() and reads context:
tokens: the input tokens the last response was answered over (uncached, cache-written and cache-read together),window: the context window of the session's model, andpercent: tokens over window.These are the same figures the status line shows (total_input_tokens, context_window_size, used_percentage). The call is free, because the mod doesn't ask for a breakdown, so it sends no token-count request.
| Hook | What it does |
|---|---|
session.start | Takes a first reading, so the band shows before the first turn. |
turn.complete | Takes a reading after each main-loop turn. Subagent turns are skipped. |
ui.render with {component: "AbovePrompt"} | Draws the band as one line. |
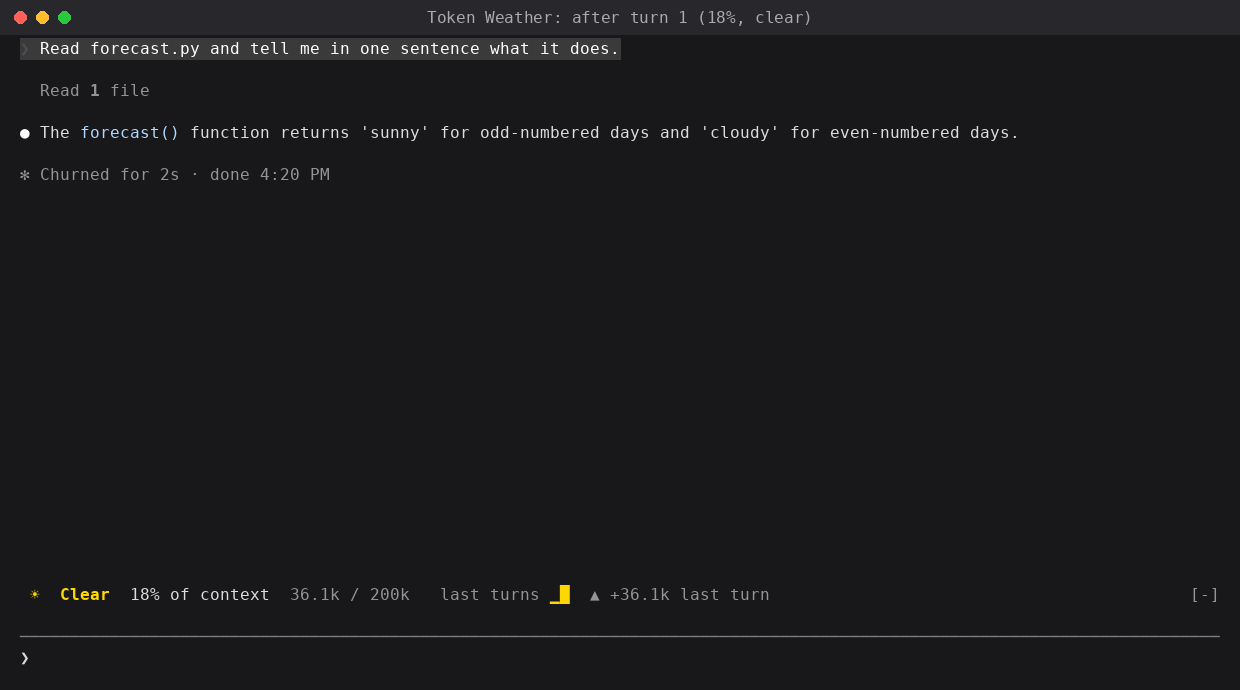
After the first turn, 18% full:
After reading four large files, 67% full:
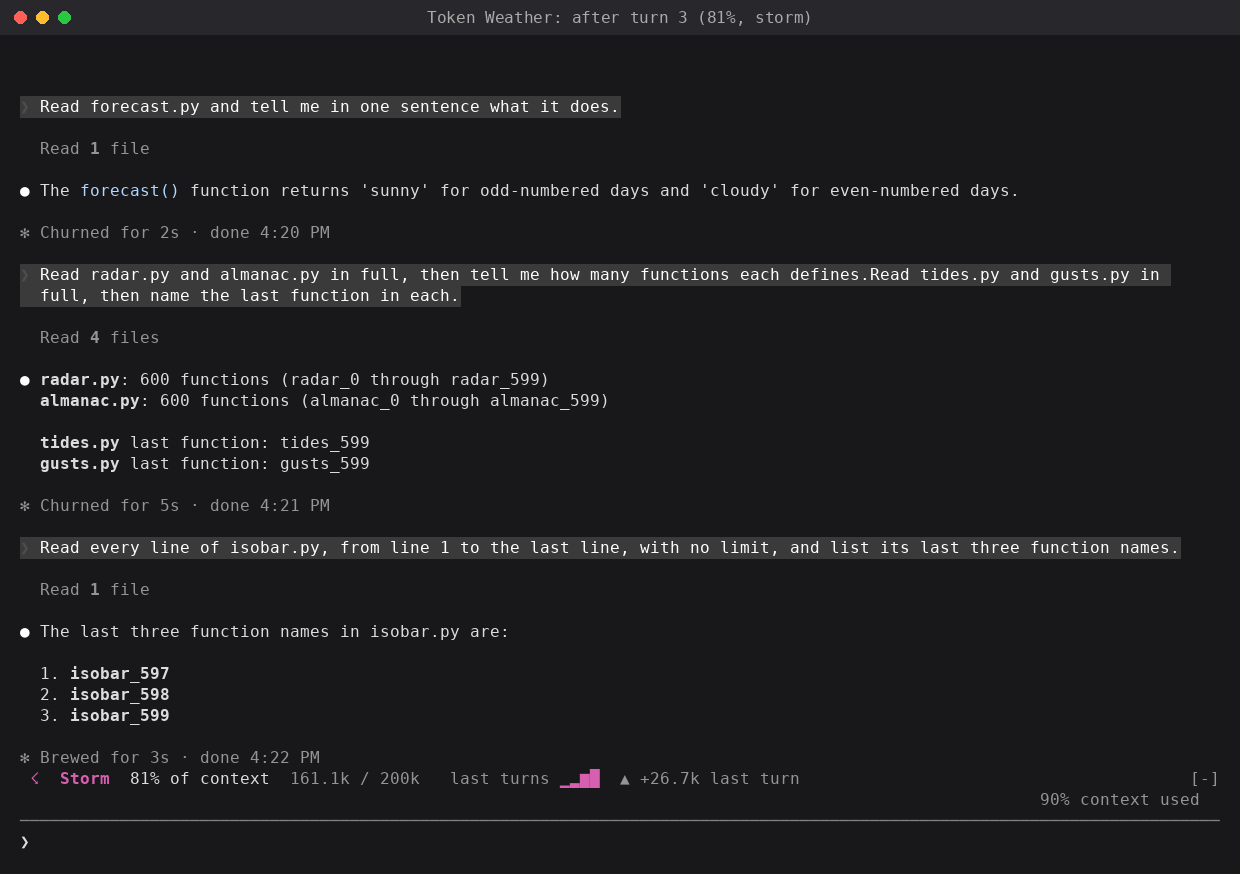
After one more file, 81% full. Claude Code's own notice reads 90%, because it counts toward the auto-compact point (see the limitations):
Token Weather. A live forecast of your context window. A band above the prompt draws a small chart of context use for each turn, as weather icons. It's clear when the window is mostly empty, and stormy when it's nearly full. It uses
ui.renderon theAbovePromptcomponent, with theSvgelement, and it updates onturn.complete. I haven't confirmed which event or call gives the token counts, so that needs a check. Developers would share it because it looks good in a screenshot, and it answers "why did Claude forget that?" at a glance. The status line only shows text. A weekend build.
The build prompt, which picked this idea and two others by number:
implement 1,2,7. give me zips for them. test them in claude code and get me screenshots of what they look like when used.
$.session.usage(), which returns the same figures as the status line, so the mod shows real numbers rather than an estimate.Svg element. The terminal can't draw Svg, so the chart is a row of block characters.Requirements:
claude plugin validate passes on 2.1.285.AbovePrompt is drawn on the terminal surface only).No environment variables or configuration.
Steps:
   git clone https://github.com/anthropics/claude-code-playground.git
cd claude-code-playground/claude-code/mods claude plugin validate ./token-weather claude --plugin-dir ./token-weatherOr install it, with the other mods here, from the local marketplace in this folder (see the mods README):
   claude plugin marketplace add ./
claude plugin install token-weather@claude-code-playground-mods --scope userAbovePrompt competes for the same band.| Name | Version | License (SPDX) | Source |
|---|---|---|---|
| None |
None.
Shared as-is as part of claude-code-playground. Not an official Anthropic product; no support or maintenance is implied. See the root README and LICENSE.
hooks/token-weather.mjs 128 lines1// Copyright 2026 Anthropic PBC
2// SPDX-License-Identifier: Apache-2.0
3// Modified 2026-10-15 by Nati Levy: the AbovePrompt hook passes the band on (see ui.render).
4//
5// Token Weather: a live forecast of the context window, above the prompt.
6//
7// turn.complete: after each main-loop turn, read the context window's fill
8// from $.session.usage() (the same figures the status line shows) and keep
9// the last HISTORY readings.
10// session.start: take a first reading, so the band shows before any turn.
11// ui.render (AbovePrompt): one line: icon, forecast word, percent, tokens
12// used of the window, and a block-character chart of the recent turns.
13//
14// The host reads on(...) and $.noun.method(...) from source, so they are
15// spelled literally, and helpers that take $ are top-level functions.
16
17const HISTORY = 12;
18const BARS = "▁▂▃▄▅▆▇█";
19
20// Forecast bands, by percent of the window used.
21const FORECAST = [
22// Single-width text symbols, not emoji: they line up in every terminal font.
23 { upTo: 25, icon: "☀", word: "Clear", color: "yellow" },
24 { upTo: 50, icon: "☁", word: "Cloudy", color: "cyan" },
25 { upTo: 75, icon: "☂", word: "Showers", color: "blue" },
26 { upTo: 90, icon: "☇", word: "Storm", color: "magenta" },
27 { upTo: Infinity, icon: "↯", word: "Compact soon", color: "red" },
28];
29
30// Readings: { tokens, window, percent }, oldest first.
31let readings = [];
32
33export function register(on) {
34 on("session.start", async ($, e, next) => {
35 const result = await next(e);
36 readings = [];
37 await takeReading($);
38 return result;
39 });
40
41 on("turn.complete", async ($, e, next) => {
42 const result = await next(e);
43 if (e.agentId) {
44 return result;
45 }
46 await takeReading($);
47 return result;
48 });
49
50 on("ui.render", { component: "AbovePrompt" }, async ($, e, next) => {
51 if (e.hasSurvey || readings.length === 0) {
52 return next(e);
53 }
54 const { Box, Text } = $.ui.resolve(e);
55 // Modified (levy-n/claude-code-mods): the band is shared, so whatever the
56 // mods after this one draw goes below the forecast instead of being dropped.
57 const below = await next(e);
58 const line = band(Box, Text, e.bodyColumns ?? 80);
59 return below ? Box({ flexDirection: "column", children: [line, below] }) : line;
60 });
61}
62
63async function takeReading($) {
64 try {
65 const { context } = await $.session.usage();
66 if (!context || !context.window) {
67 return;
68 }
69 const tokens = context.tokens ?? 0;
70 const percent = Math.round(context.percent ?? (tokens / context.window) * 100);
71 // The session.start reading is 0 before any response; drop it once real readings arrive.
72 readings = readings.filter((r) => r.tokens > 0);
73 readings.push({ tokens, window: context.window, percent });
74 if (readings.length > HISTORY) {
75 readings = readings.slice(-HISTORY);
76 }
77 $.ui.invalidate("ui.render");
78 } catch {
79 // No reading this turn; the band keeps the last one.
80 }
81}
82
83function band(Box, Text, columns) {
84 const now = readings[readings.length - 1];
85 const f = forecastFor(now.percent);
86 const trend = trendWord();
87 const parts = [
88 Text({ color: f.color, bold: true, children: `${f.icon} ${f.word}` }),
89 Text({ children: ` ${now.percent}% of context` }),
90 Text({ dimColor: true, children: ` ${short(now.tokens)} / ${short(now.window)}` }),
91 ];
92 if (columns >= 60) {
93 parts.push(Text({ dimColor: true, children: " last turns " }));
94 parts.push(Text({ color: f.color, children: chart() }));
95 if (trend) {
96 parts.push(Text({ dimColor: true, children: ` ${trend}` }));
97 }
98 }
99 return Box({ flexDirection: "row", paddingX: 1, children: parts });
100}
101
102function forecastFor(percent) {
103 return FORECAST.find((band) => percent < band.upTo) ?? FORECAST[FORECAST.length - 1];
104}
105
106// Bars scale to the busiest reading shown, so growth shows at any fill level.
107function chart() {
108 const top = Math.max(...readings.map((r) => r.tokens), 1);
109 const bars = readings.map((r) => BARS[Math.min(BARS.length - 1, Math.floor((r.tokens / top) * (BARS.length - 1)))]);
110 return bars.join("");
111}
112
113function trendWord() {
114 if (readings.length < 2) {
115 return "";
116 }
117 const delta = readings[readings.length - 1].tokens - readings[readings.length - 2].tokens;
118 if (delta > 0) return `▲ +${short(delta)} last turn`;
119 if (delta < 0) return `▼ ${short(-delta)} last turn`;
120 return "steady";
121}
122
123function short(n) {
124 if (n >= 1_000_000) return `${(n / 1_000_000).toFixed(n % 1_000_000 === 0 ? 0 : 1)}M`;
125 if (n >= 1_000) return `${(n / 1_000).toFixed(n % 1_000 === 0 ? 0 : 1)}k`;
126 return String(n);
127}
128