stats-heatmap
A stats pane with a calendar-style heatmap of your Claude Code activity
newpanecommandtimer

A stats pane with a calendar-style heatmap of your Claude Code activity
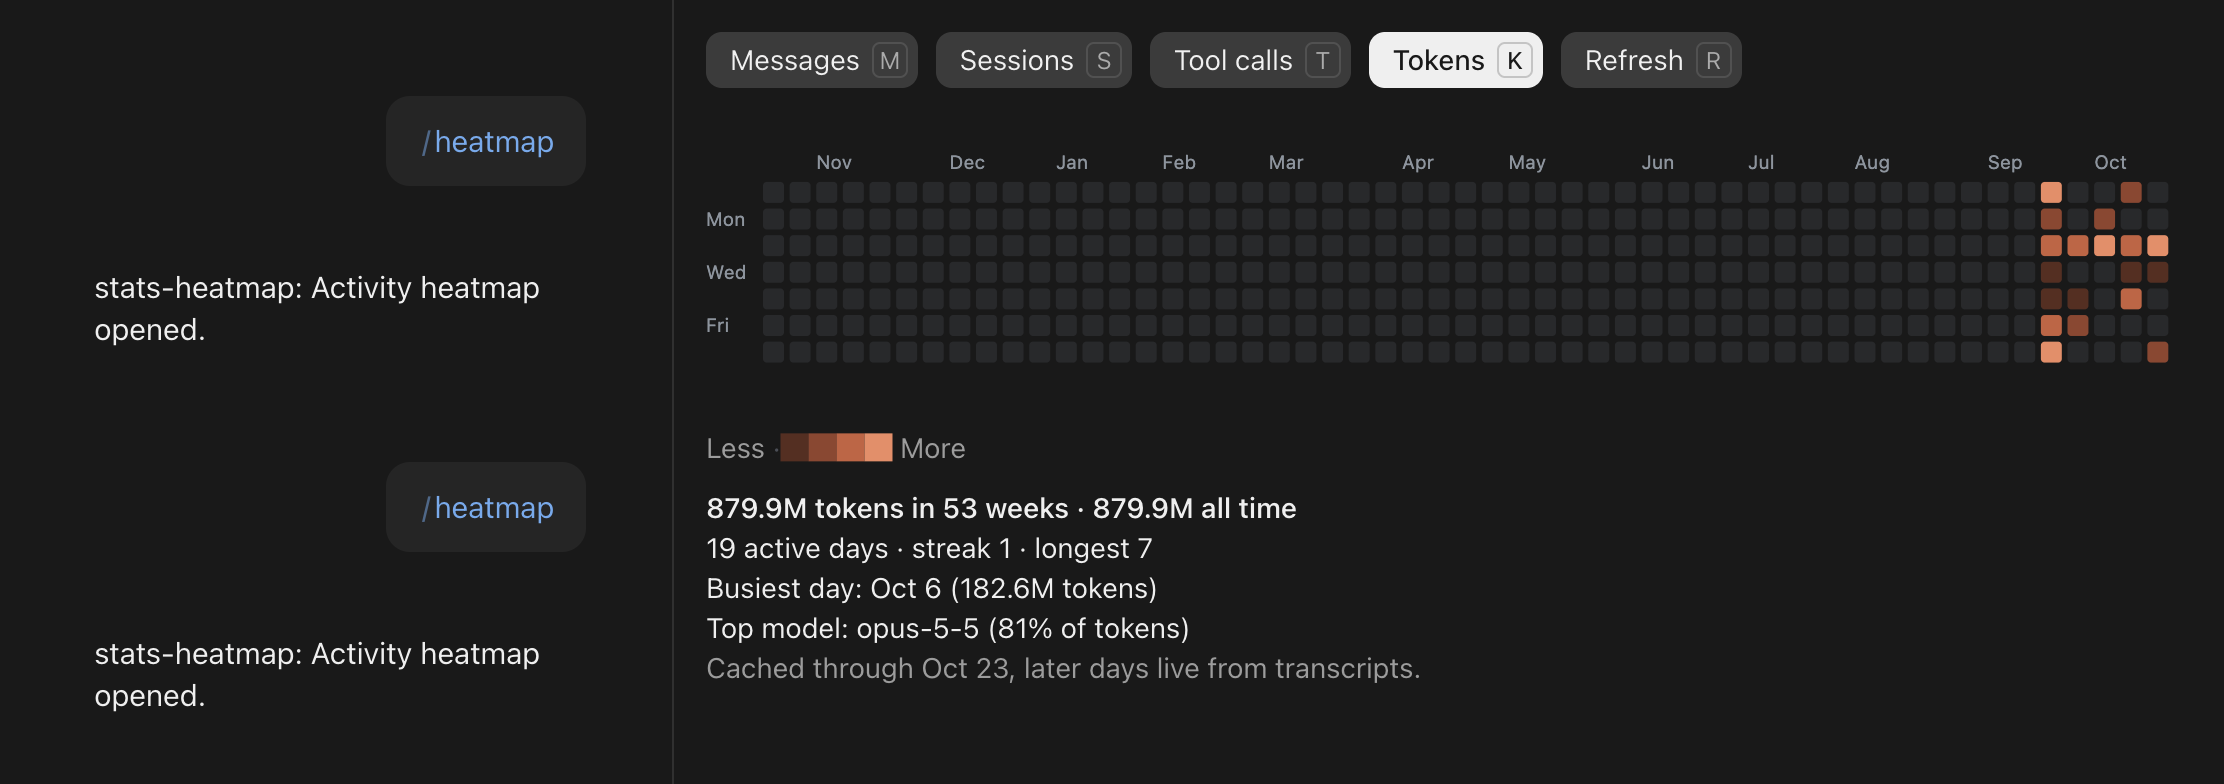
A Claude Code mod that adds a stats pane with a calendar-style heatmap of your activity, GitHub contribution-graph style.
Run /heatmap to open it. The pane shows:
m), Sessions (s), Tool calls (t), Tokens (k), and Refresh (r).In the terminal the grid is drawn as colored cells; in the desktop app and VS Code it is an SVG with a tooltip per day.
~/.claude/stats-cache.json: the daily totals Claude Code computes for its own stats, up to its lastComputedDate.~/.claude/projects/, the same way the cache counts them. Transcripts over 4 MiB are skipped and the pane says how many.The data refreshes when you run /heatmap, press Refresh, and every 5 minutes.
At the prompt of a Claude Code terminal session:
/plugin install stats-heatmap --marketplace knetic0/claude-stats-heatmapAnswer y to add the marketplace, then press Enter to pick the user scope. The mod is active right away, and in every session you start after. Then run /heatmap.
From a shell instead:
claude plugin install stats-heatmap --marketplace knetic0/claude-stats-heatmapIn the desktop app, where /plugin does not run: click + next to the prompt box, then Plugins, Add marketplace with knetic0/claude-stats-heatmap, then Add plugin.
Mods are an early-access Claude Code feature. This one was built and tested on Claude Code 2.1.310.
Clone the repository and load your working copy for one session:
claude --plugin-dir /path/to/claude-stats-heatmapOr for every session, add the folder to CLAUDE_CODE_PLUGIN_DIRS in the env block of ~/.claude/settings.json:
{ "env": { "CLAUDE_CODE_PLUGIN_DIRS": "/path/to/claude-stats-heatmap" } }Check and test it:
claude plugin validate .
claude plugin test .hooks/register.tsx: the command, the pane and its drawing.hooks/stats.ts: reading the cache and transcripts, the grid, the summary.types/index.d.ts: the state the pane draws from.hooks/register.tsx 282 lines1import { atom, read, update } from 'claude-code'
2import type { EngineInterface, Register } from 'claude-code'
3
4import type { Metric, Stats } from '../types'
5import {
6 METRICS,
7 addDays,
8 buildGrid,
9 dateStart,
10 emptyDay,
11 formatDate,
12 formatNumber,
13 levelsOf,
14 localDate,
15 monthRow,
16 parseCache,
17 scanTranscript,
18 summarize,
19 topModel,
20} from './stats'
21import type { Cell, Tally } from './stats'
22
23const PANE = 'stats-heatmap'
24const REFRESH_MS = 5 * 60_000
25
26// Change the tag when Stats' fields change: it declines what an earlier
27// version stored, which outlives a reload.
28const stats = atom({ plugin: 'stats-heatmap', key: 'stats' } as const, null, { shape: 'stats-1' })
29const metric = atom({ plugin: 'stats-heatmap', key: 'metric' } as const, 'messages')
30
31// Empty, then four levels of Claude's terracotta.
32const LEVELS: [string, ...string[]] = ['#6b7280', '#5a2d1f', '#93432c', '#c9603d', '#f08a62']
33const DEFAULT_COLOR = 0x01000000
34const BLOCK = 0x2588
35const DOT = 0x00b7
36const SPACE = 0x20
37
38const DAY_LABELS = [' ', 'Mon', ' ', 'Wed', ' ', 'Fri', ' ']
39
40const isJsonl = (name: string) => name.endsWith('.jsonl')
41
42const list = async ($: EngineInterface, path: string) => {
43 try {
44 return await $.fs.list(path)
45 } catch {
46 return []
47 }
48}
49
50// stats-cache.json covers whole days up to its lastComputedDate; the days
51// after it (usually today) are counted from the transcripts changed since.
52const load = async ($: EngineInterface) => {
53 const root = `${await $.env.get('HOME')}/.claude`
54 let tally: Tally = { days: new Map(), through: null, models: {} }
55 let error: string | null = null
56 try {
57 tally = parseCache(await $.fs.read(`${root}/stats-cache.json`))
58 } catch {
59 error = 'No stats-cache.json yet: counted from transcripts alone.'
60 }
61
62 const since = tally.through ? dateStart(addDays(tally.through, 1)) : 0
63 let skipped = 0
64 const scan = async (path: string, isSession: boolean) => {
65 try {
66 scanTranscript(await $.fs.read(path), tally.through, tally, isSession)
67 } catch {
68 skipped += 1
69 }
70 }
71
72 for (const project of await list($, `${root}/projects`)) {
73 if (project.kind !== 'dir') continue
74 const dir = `${root}/projects/${project.name}`
75 for (const entry of await list($, dir)) {
76 if (entry.kind === 'file' && isJsonl(entry.name) && entry.mtimeMs >= since) {
77 await scan(`${dir}/${entry.name}`, true)
78 } else if (entry.kind === 'dir') {
79 for (const sub of await list($, `${dir}/${entry.name}/subagents`)) {
80 if (sub.kind === 'file' && isJsonl(sub.name) && sub.mtimeMs >= since) {
81 await scan(`${dir}/${entry.name}/subagents/${sub.name}`, false)
82 }
83 }
84 }
85 }
86 }
87
88 const value: Stats = {
89 days: [...tally.days.values()],
90 through: tally.through,
91 models: tally.models,
92 skipped,
93 error,
94 loadedAt: await $.clock.now(),
95 }
96 await update($, stats, () => value)
97}
98
99const hex = (color: string) => parseInt(color.slice(1), 16)
100
101const toBase64 = (words: Uint32Array) => {
102 const bytes = new Uint8Array(words.buffer)
103 let binary = ''
104 for (let i = 0; i < bytes.length; i += 0x8000) {
105 binary += String.fromCharCode(...bytes.subarray(i, i + 0x8000))
106 }
107 return btoa(binary)
108}
109
110// One cell per day, a blank column between weeks.
111const rasterCells = (cells: Cell[][], level: (v: number) => number) => {
112 const columns = cells.length * 2 - 1
113 const words = new Uint32Array(columns * 7 * 3)
114 for (let d = 0; d < 7; d++) {
115 for (let x = 0; x < columns; x++) {
116 const at = (d * columns + x) * 3
117 const cell = x % 2 === 0 ? cells[x / 2]?.[d] : undefined
118 const n = cell && !cell.isFuture ? level(cell.value) : -1
119 words[at] = n < 0 ? SPACE : n === 0 ? DOT : BLOCK
120 words[at + 1] = n < 0 ? DEFAULT_COLOR : hex(LEVELS[n] ?? LEVELS[0])
121 words[at + 2] = DEFAULT_COLOR
122 }
123 }
124 return { columns, cells: toBase64(words) }
125}
126
127const svgHeatmap = (cells: Cell[][], level: (v: number) => number, unit: string) => {
128 const size = 11
129 const step = 14
130 const left = 30
131 const top = 18
132 const width = left + cells.length * step
133 const height = top + 7 * step
134 const label = (x: number, y: number, text: string) =>
135 `<text x="${x}" y="${y}" font-size="10" font-family="system-ui, sans-serif" fill="#8b949e">${text}</text>`
136
137 const parts: string[] = []
138 const months = monthRow(cells, 1)
139 for (let w = 0; w < months.length; w++) {
140 if (months[w] !== ' ' && (w === 0 || months[w - 1] === ' ')) {
141 parts.push(label(left + w * step, 11, months.slice(w, w + 3)))
142 }
143 }
144 DAY_LABELS.forEach((text, d) => {
145 if (text.trim()) parts.push(label(0, top + d * step + 9, text))
146 })
147 cells.forEach((week, w) =>
148 week.forEach((cell, d) => {
149 if (cell.isFuture) return
150 const n = level(cell.value)
151 const fill = n === 0 ? `fill="${LEVELS[0]}" fill-opacity="0.18"` : `fill="${LEVELS[n]}"`
152 parts.push(
153 `<rect x="${left + w * step}" y="${top + d * step}" width="${size}" height="${size}" rx="2" ${fill}>` +
154 `<title>${formatDate(cell.date)}: ${formatNumber(cell.value)} ${unit}</title></rect>`,
155 )
156 }),
157 )
158
159 return `<svg xmlns="http://www.w3.org/2000/svg" viewBox="0 0 ${width} ${height}" width="${width}" height="${height}">${parts.join('')}</svg>`
160}
161
162export const register: Register = on => {
163 on('session.start', async ($, e, next) => {
164 await $.command.register({
165 name: 'heatmap',
166 description: 'Show your Claude Code activity as a calendar heatmap',
167 })
168 void load($)
169 $.clock.every(REFRESH_MS, () => void load($))
170
171 return next(e)
172 })
173
174 on('command.run', { command: 'heatmap' }, async $ => {
175 await load($)
176 await $.ui.open({ id: PANE, title: 'Activity', columns: 64, rows: 15 })
177
178 return { text: 'Activity heatmap opened.' }
179 })
180
181 on('ui.render', { component: 'Pane', requestId: PANE }, async ($, e) => {
182 const { Box, Text, Button } = $.ui.resolve(e)
183 const data = await read($, stats)
184 const chosen = await read($, metric)
185
186 if (data === null) return <Text dimColor>Reading your activity…</Text>
187
188 const today = localDate(await $.clock.now())
189 const unit = (METRICS.find(m => m.id === chosen)?.label ?? chosen).toLowerCase()
190 const weeks = e.surface === 'terminal' ? Math.max(4, Math.min(53, Math.floor((e.props.bodyColumns - 3) / 2))) : 53
191 const cells = buildGrid(data.days, chosen, weeks, today)
192 const level = levelsOf(cells)
193 const all = summarize(data.days, chosen, today)
194 const shown = summarize(
195 cells.flat().map(c => ({ ...emptyDay(c.date), [chosen]: c.value })),
196 chosen,
197 today,
198 )
199 const model = topModel(data.models)
200 const pick = (id: Metric) => () => update($, metric, () => id)
201
202 let heatmap
203 if (e.surface === 'terminal') {
204 const { Raster } = $.ui.resolve(e)
205 heatmap = (
206 <Box flexDirection="column">
207 <Text dimColor>{' ' + monthRow(cells, 2)}</Text>
208 <Box>
209 <Box flexDirection="column" width={4}>
210 {DAY_LABELS.map(text => (
211 <Text dimColor>{text}</Text>
212 ))}
213 </Box>
214 <Raster key="grid" rows={7} {...rasterCells(cells, level)} />
215 </Box>
216 </Box>
217 )
218 } else {
219 const { Svg } = $.ui.resolve(e)
220 heatmap = (
221 <Svg
222 source={svgHeatmap(cells, level, unit)}
223 alt={`${formatNumber(shown.total)} ${unit} over the last ${weeks} weeks`}
224 isInteractive
225 />
226 )
227 }
228
229 return (
230 <Box flexDirection="column" gap={1}>
231 <Box flexWrap="wrap" columnGap={1}>
232 {METRICS.map(m => (
233 <Button
234 key={m.id}
235 label={m.label}
236 hotkey={m.hotkey}
237 variant={m.id === chosen ? 'primary' : 'secondary'}
238 onPress={pick(m.id)}
239 />
240 ))}
241 <Button key="refresh" label="Refresh" hotkey="r" onPress={() => load($)} />
242 </Box>
243 {heatmap}
244 <Box>
245 <Text dimColor>Less </Text>
246 {LEVELS.map((color, n) => (
247 <Text color={color} dimColor={n === 0}>
248 {n === 0 ? '·' : '█'}
249 </Text>
250 ))}
251 <Text dimColor> More</Text>
252 </Box>
253 <Box flexDirection="column">
254 <Text bold>
255 {`${formatNumber(shown.total)} ${unit} in ${weeks} weeks · ${formatNumber(all.total)} all time`}
256 </Text>
257 <Text>
258 {all.activeDays} active days · streak {all.streak} · longest {all.longestStreak}
259 </Text>
260 {all.best && (
261 <Text>
262 Busiest day: {formatDate(all.best.date)} ({formatNumber(all.best[chosen])} {unit})
263 </Text>
264 )}
265 {model && (
266 <Text>
267 Top model: {model.name} ({model.share}% of tokens)
268 </Text>
269 )}
270 <Text dimColor>
271 {data.error ??
272 (data.through
273 ? `Cached through ${formatDate(data.through)}, later days live from transcripts.`
274 : 'Counted from transcripts.')}
275 {data.skipped > 0 ? ` ${data.skipped} transcripts too large to read were left out.` : ''}
276 </Text>
277 </Box>
278 </Box>
279 )
280 })
281}
282hooks/stats.ts 258 lines1import type { Day, Metric } from '../types'
2
3export const METRICS: { id: Metric; label: string; hotkey: string }[] = [
4 { id: 'messages', label: 'Messages', hotkey: 'm' },
5 { id: 'sessions', label: 'Sessions', hotkey: 's' },
6 { id: 'tools', label: 'Tool calls', hotkey: 't' },
7 { id: 'tokens', label: 'Tokens', hotkey: 'k' },
8]
9
10const MONTHS = ['Jan', 'Feb', 'Mar', 'Apr', 'May', 'Jun', 'Jul', 'Aug', 'Sep', 'Oct', 'Nov', 'Dec']
11
12const pad = (n: number) => String(n).padStart(2, '0')
13
14// Year, month (1-12) and day of a YYYY-MM-DD date.
15const partsOf = (date: string) => {
16 const [y = 1970, m = 1, d = 1] = date.split('-').map(Number)
17 return { y, m, d }
18}
19
20export const localDate = (ms: number) => {
21 const d = new Date(ms)
22 return `${d.getFullYear()}-${pad(d.getMonth() + 1)}-${pad(d.getDate())}`
23}
24
25// Midnight local time of a YYYY-MM-DD date.
26export const dateStart = (date: string) => {
27 const { y, m, d } = partsOf(date)
28 return new Date(y, m - 1, d).getTime()
29}
30
31export const addDays = (date: string, n: number) => {
32 const { y, m, d } = partsOf(date)
33 return localDate(new Date(y, m - 1, d + n).getTime())
34}
35
36export const emptyDay = (date: string): Day => ({
37 date,
38 messages: 0,
39 sessions: 0,
40 tools: 0,
41 tokens: 0,
42})
43
44type Cache = {
45 lastComputedDate?: string
46 dailyActivity?: { date: string; messageCount?: number; sessionCount?: number; toolCallCount?: number }[]
47 dailyModelTokens?: { date: string; tokensByModel?: Record<string, number> }[]
48 modelUsage?: Record<
49 string,
50 {
51 inputTokens?: number
52 outputTokens?: number
53 cacheReadInputTokens?: number
54 cacheCreationInputTokens?: number
55 }
56 >
57}
58
59export type Tally = {
60 days: Map<string, Day>
61 through: string | null
62 models: Record<string, number>
63}
64
65const dayOf = (tally: Tally, date: string) => {
66 let day = tally.days.get(date)
67 if (!day) {
68 day = emptyDay(date)
69 tally.days.set(date, day)
70 }
71 return day
72}
73
74// Reads ~/.claude/stats-cache.json, the file Claude Code's own stats are computed into.
75export const parseCache = (text: string): Tally => {
76 const cache = JSON.parse(text) as Cache
77 const tally: Tally = { days: new Map(), through: cache.lastComputedDate ?? null, models: {} }
78
79 for (const row of cache.dailyActivity ?? []) {
80 const day = dayOf(tally, row.date)
81 day.messages = row.messageCount ?? 0
82 day.sessions = row.sessionCount ?? 0
83 day.tools = row.toolCallCount ?? 0
84 }
85 for (const row of cache.dailyModelTokens ?? []) {
86 const byModel = row.tokensByModel ?? {}
87 dayOf(tally, row.date).tokens = Object.values(byModel).reduce((a, b) => a + b, 0)
88 }
89 for (const [model, u] of Object.entries(cache.modelUsage ?? {})) {
90 tally.models[model] =
91 (u.inputTokens ?? 0) +
92 (u.outputTokens ?? 0) +
93 (u.cacheReadInputTokens ?? 0) +
94 (u.cacheCreationInputTokens ?? 0)
95 }
96
97 return tally
98}
99
100type Entry = {
101 type?: string
102 timestamp?: string
103 message?: {
104 model?: string
105 content?: unknown
106 usage?: {
107 input_tokens?: number
108 output_tokens?: number
109 cache_read_input_tokens?: number
110 cache_creation_input_tokens?: number
111 }
112 }
113}
114
115// Adds one transcript's entries dated after `after` to the tally, counting the
116// way stats-cache.json does: user, assistant and attachment rows are messages,
117// tool_use blocks are tool calls, and tokens include cache reads and writes.
118// A transcript counts as a session on the day of its first entry.
119export const scanTranscript = (text: string, after: string | null, tally: Tally, isSession: boolean) => {
120 let first: string | null = null
121
122 for (const line of text.split('\n')) {
123 if (!line.includes('"timestamp"')) continue
124 let entry: Entry
125 try {
126 entry = JSON.parse(line)
127 } catch {
128 continue
129 }
130 if (!entry.timestamp) continue
131 const ms = Date.parse(entry.timestamp)
132 if (Number.isNaN(ms)) continue
133 const date = localDate(ms)
134 first ??= date
135 if (after !== null && date <= after) continue
136 if (entry.type !== 'user' && entry.type !== 'assistant' && entry.type !== 'attachment') continue
137
138 const day = dayOf(tally, date)
139 day.messages += 1
140 if (entry.type !== 'assistant' || !entry.message) continue
141
142 const content = entry.message.content
143 if (Array.isArray(content)) {
144 day.tools += content.filter(b => b && typeof b === 'object' && b.type === 'tool_use').length
145 }
146 const u = entry.message.usage
147 if (u) {
148 const tokens =
149 (u.input_tokens ?? 0) +
150 (u.output_tokens ?? 0) +
151 (u.cache_read_input_tokens ?? 0) +
152 (u.cache_creation_input_tokens ?? 0)
153 day.tokens += tokens
154 const model = entry.message.model
155 if (model && model !== '<synthetic>') tally.models[model] = (tally.models[model] ?? 0) + tokens
156 }
157 }
158
159 if (isSession && first !== null && (after === null || first > after)) dayOf(tally, first).sessions += 1
160}
161
162export type Cell = { date: string; value: number; isFuture: boolean }
163
164// Weeks run Sunday to Saturday, the last column holding today.
165export const buildGrid = (days: Day[], metric: Metric, weeks: number, today: string): Cell[][] => {
166 const byDate = new Map(days.map(d => [d.date, d[metric]]))
167 const weekday = new Date(dateStart(today)).getDay()
168 const start = addDays(today, -weekday - (weeks - 1) * 7)
169
170 return Array.from({ length: weeks }, (_, w) =>
171 Array.from({ length: 7 }, (_, d) => {
172 const date = addDays(start, w * 7 + d)
173 return { date, value: byDate.get(date) ?? 0, isFuture: date > today }
174 }),
175 )
176}
177
178// Four levels, split at the quartiles of the days with any activity.
179export const levelsOf = (cells: Cell[][]) => {
180 const values = cells
181 .flat()
182 .map(c => c.value)
183 .filter(v => v > 0)
184 .sort((a, b) => a - b)
185 const at = (q: number) => values[Math.min(values.length - 1, Math.floor(q * values.length))] ?? 0
186 const cuts = [at(0.25), at(0.5), at(0.75)]
187
188 return (value: number) => (value <= 0 ? 0 : 1 + cuts.filter(c => value > c).length)
189}
190
191// Month names over the first week that starts in each month, where they fit.
192export const monthRow = (cells: Cell[][], stride: number) => {
193 const width = cells.length * stride
194 const row = Array<string>(width).fill(' ')
195 let free = 0
196 cells.forEach((week, w) => {
197 const { m, d } = partsOf(week[0]?.date ?? '')
198 const at = w * stride
199 if (d <= 7 && at >= free && at + 3 <= width) {
200 ;[...(MONTHS[m - 1] ?? '')].forEach((ch, i) => (row[at + i] = ch))
201 free = at + 4
202 }
203 })
204 return row.join('').trimEnd()
205}
206
207export type Summary = {
208 total: number
209 activeDays: number
210 streak: number
211 longestStreak: number
212 best: Day | null
213}
214
215export const summarize = (days: Day[], metric: Metric, today: string): Summary => {
216 const active = days.filter(d => d[metric] > 0 && d.date <= today).sort((a, b) => (a.date < b.date ? -1 : 1))
217 let longestStreak = 0
218 let run = 0
219 let prev: string | null = null
220 for (const day of active) {
221 run = prev !== null && addDays(prev, 1) === day.date ? run + 1 : 1
222 longestStreak = Math.max(longestStreak, run)
223 prev = day.date
224 }
225 // A streak still counts while today has nothing yet.
226 const last = active.at(-1)?.date
227 const streak = last === today || last === addDays(today, -1) ? run : 0
228
229 return {
230 total: active.reduce((sum, d) => sum + d[metric], 0),
231 activeDays: active.length,
232 streak,
233 longestStreak,
234 best: active.reduce<Day | null>((b, d) => (b === null || d[metric] > b[metric] ? d : b), null),
235 }
236}
237
238export const formatNumber = (n: number) => {
239 if (n >= 1e9) return `${(n / 1e9).toFixed(1)}B`
240 if (n >= 1e6) return `${(n / 1e6).toFixed(1)}M`
241 if (n >= 1e4) return `${(n / 1e3).toFixed(1)}k`
242 return String(n).replace(/\B(?=(\d{3})+(?!\d))/g, ',')
243}
244
245export const formatDate = (date: string) => {
246 const { m, d } = partsOf(date)
247 return `${MONTHS[m - 1]} ${d}`
248}
249
250export const modelName = (model: string) => model.replace(/^claude-/, '').replace(/-\d{8}$/, '')
251
252export const topModel = (models: Record<string, number>) => {
253 const total = Object.values(models).reduce((a, b) => a + b, 0)
254 const [name, tokens] = Object.entries(models).sort((a, b) => b[1] - a[1])[0] ?? []
255 if (!name || !tokens || total === 0) return null
256 return { name: modelName(name), share: Math.round((tokens / total) * 100) }
257}
258types/index.d.ts 27 lines1export type Metric = 'messages' | 'sessions' | 'tools' | 'tokens'
2
3export type Day = {
4 date: string
5 messages: number
6 sessions: number
7 tools: number
8 tokens: number
9}
10
11export type Stats = {
12 days: Day[]
13 // The last day stats-cache.json covers; later days are counted from transcripts.
14 through: string | null
15 models: Record<string, number>
16 // Transcripts too large to read (over 4 MiB), left out of the live count.
17 skipped: number
18 error: string | null
19 loadedAt: number
20}
21
22declare module 'claude-code' {
23 interface PluginState {
24 'stats-heatmap': { stats: Shaped<Stats | null>; metric: Metric }
25 }
26}
27