usage-stats
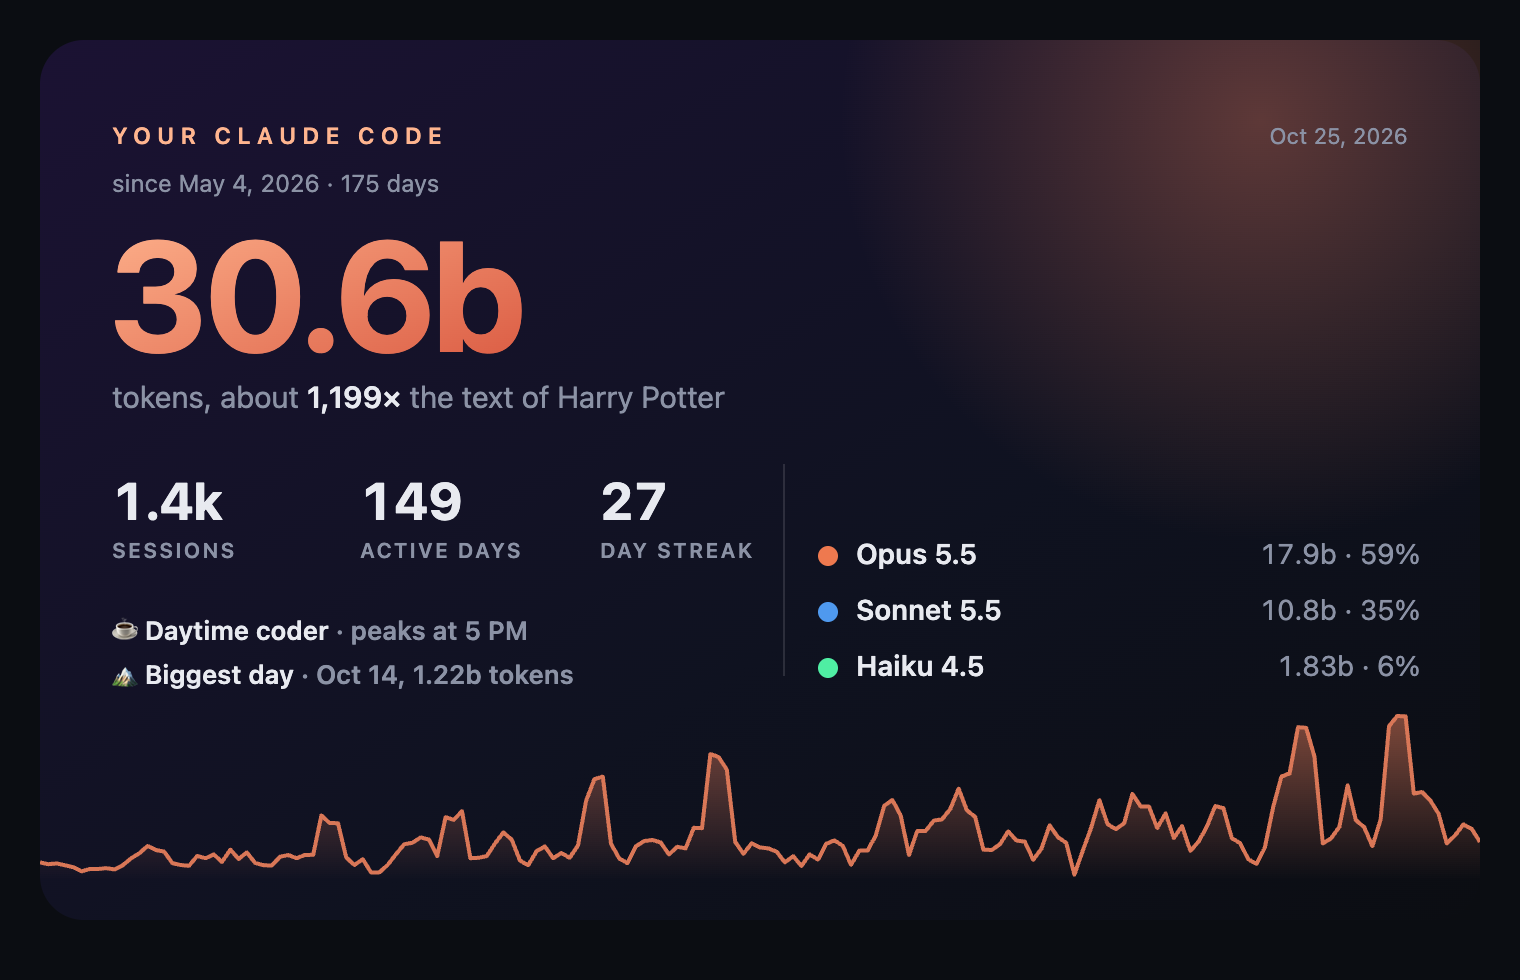
Claude Code usage stats in the desktop app: a token heat map, usage history by model, an hour-of-day chart and a Spotify Wrapped style year-in-review card.
newpanecommandtoastprocess
Claude Code usage stats in the desktop app: a token heat map, usage history by model, an hour-of-day chart and a Spotify Wrapped style year-in-review card.
Your Claude Code usage stats as a heat map in the desktop app, plus a Spotify Wrapped style card you can save and share.
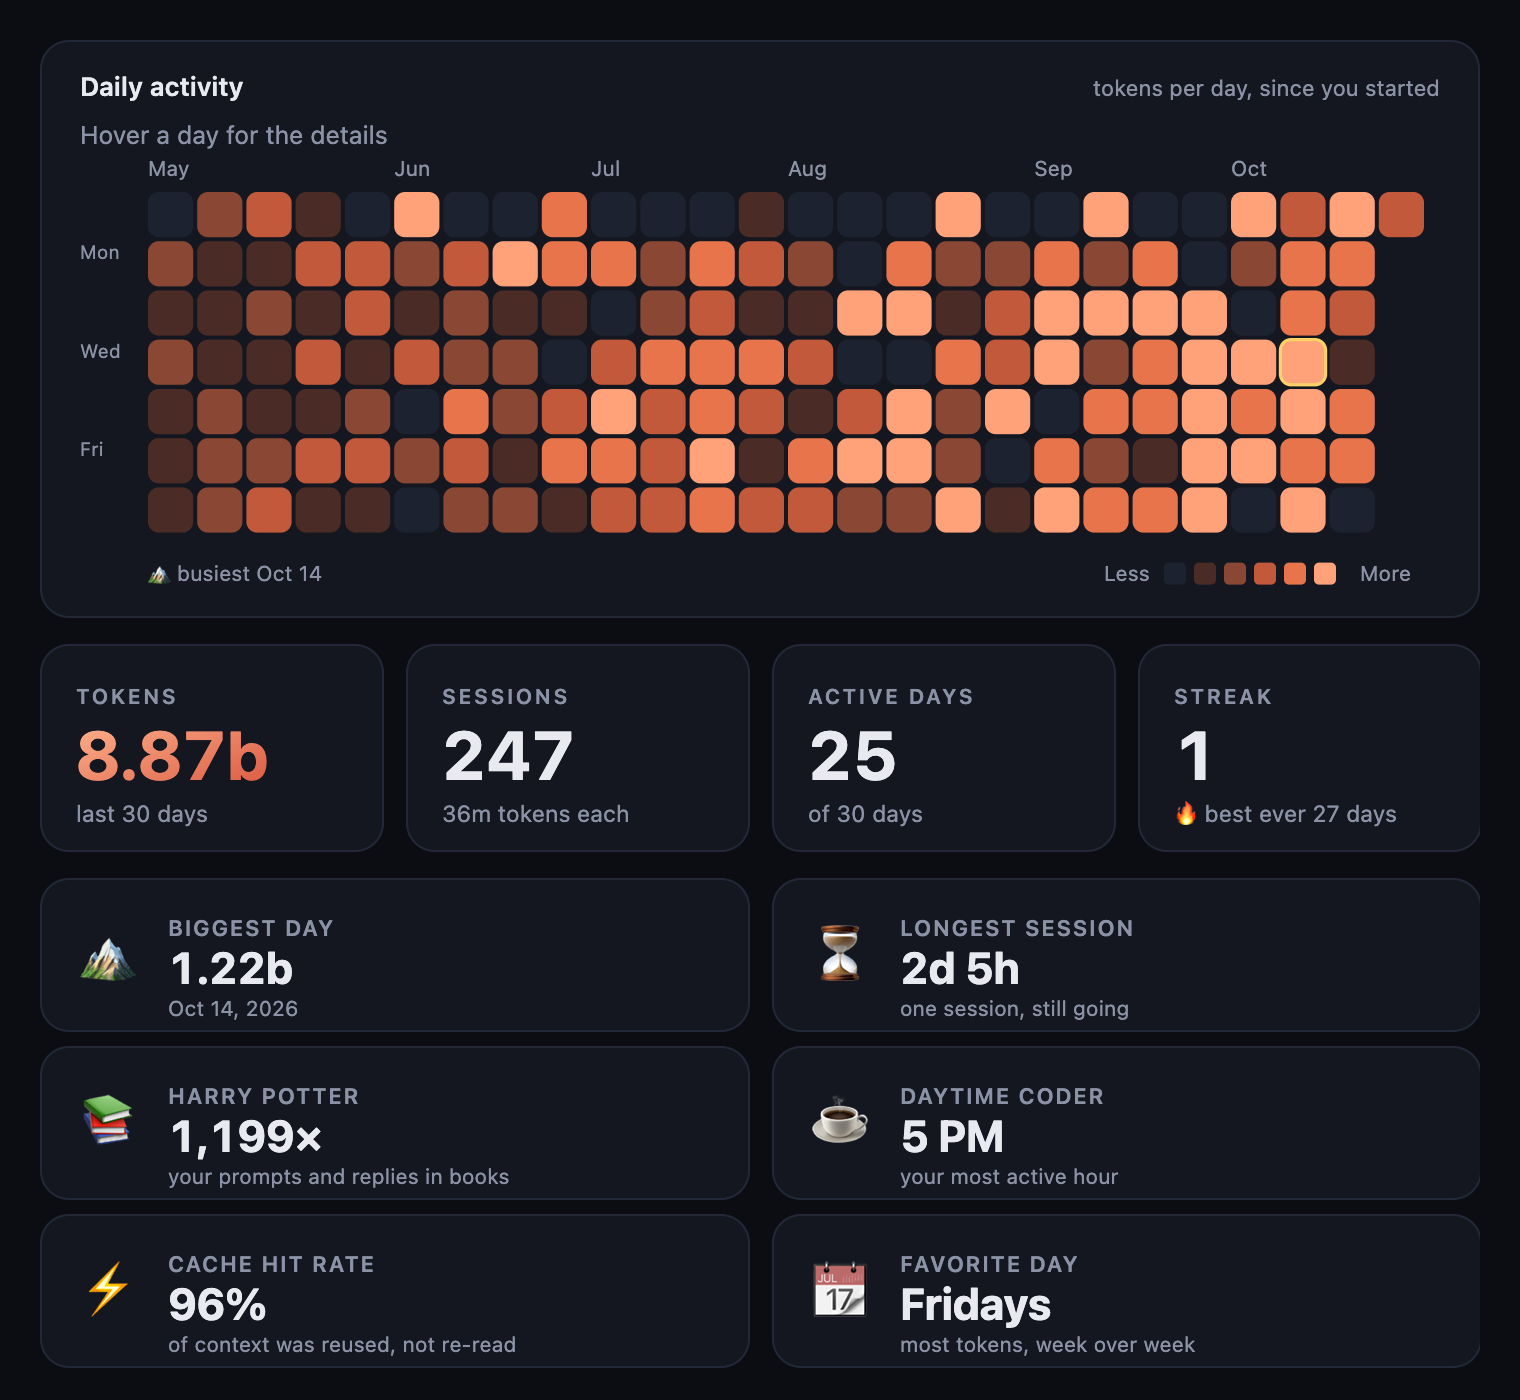
The screenshots in this README use made-up sample data, not anyone's real usage.
I used to see a summary of my recent usage every time I opened a new session: a calendar heat map of how many tokens I used each day, with totals for the last 7 days, the last 30 days, and all time. I couldn't find it anymore, and it turns out the screen is still there, it's just tucked behind /stats in the terminal version of Claude Code. I wanted it sitting right next to my chat in the desktop app, so I built it as a Claude Code mod. Type /usage-stats and a dashboard opens in a side pane.
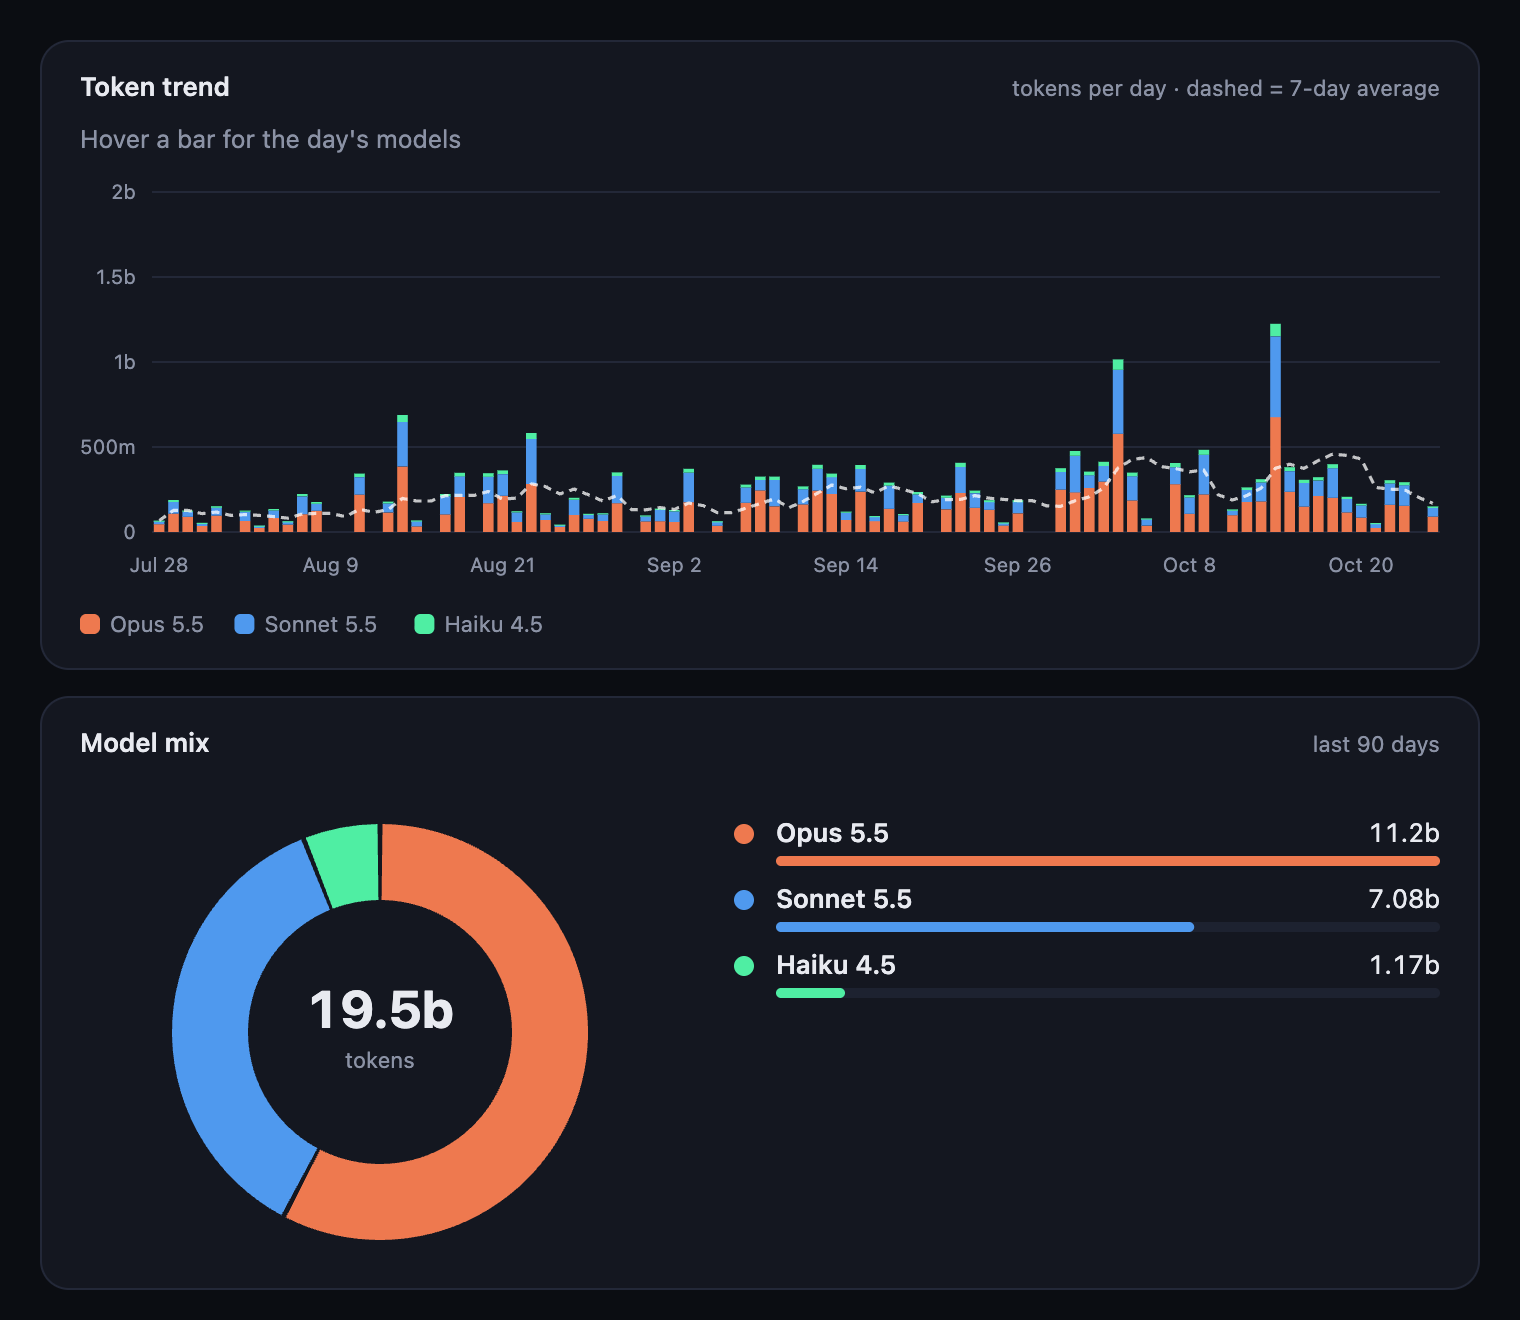
The dashboard has four tabs, a 7d / 30d / 90d / All switch, and a chip for every model so you can turn one on or off and watch everything redraw.
In the desktop app, click + next to the prompt box, then Plugins, then Add marketplace and enter connorchuang32/claude-usage-stats, then Add plugin.
In a terminal session:
/plugin install usage-stats --marketplace connorchuang32/claude-usage-statsFrom a shell:
claude plugin install usage-stats --marketplace connorchuang32/claude-usage-statsThen run /usage-stats in the desktop app.
~/.claude/stats-cache.json, the file the terminal /stats command keeps up to date. If you've never run /stats, open claude in a terminal, type /stats once, and then come back.python3 (macOS ships with one). The footer tells you whether you're looking at live numbers or just the cache.Everything stays on your computer. The scan opens your session files to read the model name, token counts and timestamps, and nothing else is kept or sent anywhere. The "Save card" button writes one file, claude-code-wrapped.svg, to your Downloads folder.
The scan counts tokens the same way /stats does, so totals match. For the newest days they can still land a few percent off what the terminal shows, since the cache and your session files don't always agree.
MIT, see LICENSE.
hooks/register.tsx 197 lines1import { atom, read, update } from 'claude-code'
2import type { EngineInterface, Register } from 'claude-code'
3
4import type { LiveScan, RangeKey, TabKey } from '../types'
5import { clock, compact, derive, facts, heatmap, hero, longDay, modelName, models, trends, types, wrapped } from './dash'
6import type { Stats } from './dash'
7
8const PANE = 'usage-stats'
9const tab = atom({ plugin: 'usage-stats', key: 'tab' } as const, 'overview' as TabKey)
10const range = atom({ plugin: 'usage-stats', key: 'range' } as const, '30' as RangeKey)
11const hidden = atom({ plugin: 'usage-stats', key: 'hidden' } as const, [] as string[])
12const live = atom({ plugin: 'usage-stats', key: 'live' } as const, null as LiveScan | null)
13const status = atom({ plugin: 'usage-stats', key: 'status' } as const, 'idle' as 'idle' | 'busy' | 'failed')
14const TABS: [TabKey, string][] = [
15 ['overview', 'Overview'],
16 ['trends', 'Trends'],
17 ['models', 'Models'],
18 ['wrapped', 'Wrapped'],
19]
20const RANGES: [RangeKey, string][] = [
21 ['7', '7d'],
22 ['30', '30d'],
23 ['90', '90d'],
24 ['all', 'All'],
25]
26
27const localToday = () => {
28 const now = new Date()
29 const pad = (n: number) => String(n).padStart(2, '0')
30
31 return `${now.getFullYear()}-${pad(now.getMonth() + 1)}-${pad(now.getDate())}`
32}
33
34type Ctx = EngineInterface
35
36const loadStats = async ($: Ctx): Promise<Stats> => {
37 const home = await $.env.get('HOME')
38
39 return JSON.parse(await $.fs.read(`${home}/.claude/stats-cache.json`))
40}
41
42// The CLI's stats cache stops at its last run; the scanner adds the days since from the transcripts.
43const refresh = async ($: Ctx) => {
44 await update($, status, () => 'busy')
45 try {
46 const home = await $.env.get('HOME')
47 const stats = await loadStats($)
48 const since = new Date(Date.parse(stats.lastComputedDate + 'T00:00:00Z') + 86400000).toISOString().slice(0, 10)
49 const out = await $.process.run(['/usr/bin/env', 'python3', '-I', `${$.plugin.root}/scan.py`, `${home}/.claude/projects`, since], { timeoutMs: 180000 })
50 if (out.exitCode !== 0) throw new Error(out.stderr)
51 const scan = JSON.parse(out.stdout)
52 await update($, live, () => ({ days: scan.days, sessions: scan.sessions, at: Date.now() }))
53 await update($, status, () => 'idle')
54 } catch {
55 await update($, status, () => 'failed')
56 }
57}
58
59export const register: Register = on => {
60 on('session.start', async ($, e, next) => {
61 await $.command.register({
62 name: 'usage-stats',
63 description: 'Open the usage dashboard: heat map, trends, models and a year-in-review card',
64 })
65
66 return next(e)
67 })
68
69 on('command.run', { command: 'usage-stats' }, async $ => {
70 await $.ui.open({ id: PANE, title: 'Usage' })
71 void refresh($)
72
73 return { text: 'Usage dashboard opened.' }
74 })
75
76 on('ui.render', { component: 'Pane', requestId: PANE }, async ($, e) => {
77 const table = $.ui.resolve(e)
78 const { Box, Text, Button } = table
79 if (!('Svg' in table)) {
80 return (
81 <Box padding="md">
82 <Text dimColor>The usage dashboard draws charts, which this surface cannot show. Open it in the desktop app.</Text>
83 </Box>
84 )
85 }
86 const { Svg } = table
87 // The pane caps an Svg's height unless it is sized, so each chart is drawn at its own pixel size.
88 const pic = (source: string, alt: string) => {
89 const box = /viewBox="0 0 (\d+) (\d+)"/.exec(source)
90
91 return <Svg isInteractive source={source} alt={alt} width={Number(box?.[1])} height={Number(box?.[2])} />
92 }
93 const [view, pick, off, scan, busy] = await Promise.all([read($, tab), read($, range), read($, hidden), read($, live), read($, status)])
94
95 let stats: Stats
96 try {
97 stats = await loadStats($)
98 } catch {
99 return (
100 <Box padding="lg" backgroundColor="#0b0d12">
101 <Text color="#8b92a5">No stats cache yet. Run /stats once in the terminal CLI, then reopen this pane.</Text>
102 </Box>
103 )
104 }
105
106 const d = derive(stats, scan, pick, off, localToday())
107 const chip = (key: string, label: string, active: boolean, onPress: () => void) => (
108 <Button key={key} onPress={onPress}>
109 <Text color={active ? '#0b0d12' : '#c9ced9'} backgroundColor={active ? '#d97757' : '#1c202b'} bold={active}>
110 {` ${label} `}
111 </Text>
112 </Button>
113 )
114 const modelChip = (id: string) => {
115 const isOn = !off.includes(id)
116
117 return (
118 <Button key={id} onPress={() => update($, hidden, list => (list.includes(id) ? list.filter(x => x !== id) : [...list, id]))}>
119 <Text color={isOn ? d.color[id] : '#4b5263'}>● </Text>
120 <Text color={isOn ? '#e8eaf0' : '#4b5263'} strikethrough={!isOn}>{`${modelName(id)} `}</Text>
121 </Button>
122 )
123 }
124 const saveCard = async () => {
125 const home = await $.env.get('HOME')
126 const path = `${home}/Downloads/claude-code-wrapped.svg`
127 await $.fs.write(path, wrapped(d))
128 $.ui.toast(`Saved your card to ${path}`)
129 }
130
131 const note =
132 busy === 'busy'
133 ? '⟳ Reading your transcripts for the latest days…'
134 : busy === 'failed'
135 ? 'Could not scan transcripts; showing the stats cache only.'
136 : scan
137 ? `Live through ${longDay(d.today)}`
138 : `Stats cache through ${longDay(stats.lastComputedDate)}`
139
140 const isWrapped = view === 'wrapped'
141
142 return (
143 <Box flexDirection="column" gap="md" padding="md" backgroundColor="#0b0d12">
144 <Box gap="lg" flexWrap="wrap" alignItems="center">
145 <Box gap="xs">{TABS.map(([k, label]) => chip(k, label, view === k, () => update($, tab, () => k)))}</Box>
146 {!isWrapped && <Box gap="xs">{RANGES.map(([k, label]) => chip('r' + k, label, pick === k, () => update($, range, () => k)))}</Box>}
147 <Button key="refresh" onPress={() => refresh($)}>
148 <Text color="#8b92a5">{busy === 'busy' ? '⟳ refreshing' : '↻ refresh'}</Text>
149 </Button>
150 </Box>
151
152 {!isWrapped && (
153 <Box gap="xs" flexWrap="wrap">
154 {d.ids.slice(0, 10).map(modelChip)}
155 </Box>
156 )}
157
158 {view === 'overview' && (
159 <Box flexDirection="column" gap="md">
160 {pic(heatmap(d), 'Heat map of daily token usage')}
161 {pic(hero(d), `${compact(d.rangeTotal)} tokens, ${d.rangeSessions} sessions`)}
162 {pic(facts(d), 'Fun facts about your usage')}
163 </Box>
164 )}
165 {view === 'trends' && (
166 <Box flexDirection="column" gap="md">
167 {pic(hero(d), 'Totals for the selected range')}
168 {pic(trends(d), 'Stacked token usage by model over time')}
169 </Box>
170 )}
171 {view === 'models' && (
172 <Box flexDirection="column" gap="md">
173 {pic(models(d), 'Share of tokens by model')}
174 {pic(types(d), 'Share of tokens by type')}
175 {pic(clock(d), 'Message activity by hour of day')}
176 </Box>
177 )}
178 {isWrapped && (
179 <Box flexDirection="column" gap="md">
180 {pic(wrapped(d), 'Your Claude Code year in review card')}
181 <Box gap="md" alignItems="center">
182 <Button key="save" onPress={saveCard}>
183 <Text color="#0b0d12" backgroundColor="#d97757" bold>
184 {' ⬇ Save card as SVG '}
185 </Text>
186 </Button>
187 <Text color="#8b92a5">Saves to Downloads, or just screenshot it.</Text>
188 </Box>
189 </Box>
190 )}
191
192 <Text color="#6b7385">{note}</Text>
193 </Box>
194 )
195 })
196}
197hooks/dash.ts 667 lines1// Pure data prep and SVG drawing for the usage pane: no engine imports, so it runs in Node too.
2
3export type Daily = { date: string; messageCount: number; sessionCount: number; toolCallCount: number }
4export type DayTokens = { date: string; tokensByModel: Record<string, number> }
5export type Usage = {
6 inputTokens: number
7 outputTokens: number
8 cacheReadInputTokens: number
9 cacheCreationInputTokens: number
10}
11export type Stats = {
12 lastComputedDate: string
13 firstSessionDate: string
14 dailyActivity: Daily[]
15 dailyModelTokens: DayTokens[]
16 modelUsage: Record<string, Usage>
17 totalSessions: number
18 longestSession: { duration: number }
19 hourCounts: Record<string, number>
20}
21export type Live = { days: Record<string, Record<string, number>>; sessions: Record<string, number> }
22export type RangeKey = '7' | '30' | '90' | 'all'
23
24const DAY = 86400000
25const MONTHS = ['Jan', 'Feb', 'Mar', 'Apr', 'May', 'Jun', 'Jul', 'Aug', 'Sep', 'Oct', 'Nov', 'Dec']
26const WEEKDAYS = ['Sundays', 'Mondays', 'Tuesdays', 'Wednesdays', 'Thursdays', 'Fridays', 'Saturdays']
27const HARRY_POTTER = 103000
28
29export const ms = (date: string) => Date.parse(date + 'T00:00:00Z')
30export const iso = (t: number) => new Date(t).toISOString().slice(0, 10)
31export const addDays = (date: string, n: number) => iso(ms(date) + n * DAY)
32export const shortDay = (date: string) => MONTHS[Number(date.slice(5, 7)) - 1] + ' ' + Number(date.slice(8, 10))
33export const longDay = (date: string) => shortDay(date) + ', ' + date.slice(0, 4)
34
35export const compact = (n: number) => {
36 if (n >= 1e9) return (n / 1e9).toFixed(n >= 1e10 ? 1 : 2).replace(/\.?0+$/, '') + 'b'
37 if (n >= 1e6) return (n / 1e6).toFixed(n >= 1e7 ? 0 : 1).replace(/\.0$/, '') + 'm'
38 if (n >= 1e3) return (n / 1e3).toFixed(n >= 1e4 ? 0 : 1).replace(/\.0$/, '') + 'k'
39 return String(Math.round(n))
40}
41
42export const duration = (msec: number) => {
43 const mins = Math.floor(msec / 60000)
44 const d = Math.floor(mins / 1440)
45 const h = Math.floor((mins % 1440) / 60)
46 return d ? `${d}d ${h}h` : h ? `${h}h ${mins % 60}m` : `${mins}m`
47}
48
49export const modelName = (id: string) => {
50 const m = /^claude-(opus|sonnet|haiku|fable)-(\d+)(?:-(\d{1,2}))?(?:-\d{8})?$/.exec(id)
51 if (!m) return id
52 const fam = m[1] ?? ''
53 return fam.charAt(0).toUpperCase() + fam.slice(1) + ' ' + m[2] + (m[3] ? '.' + m[3] : '')
54}
55
56const hourName = (h: number) => (h === 0 ? '12 AM' : h < 12 ? h + ' AM' : h === 12 ? '12 PM' : h - 12 + ' PM')
57
58const esc = (s: string) => s.replace(/&/g, '&').replace(/</g, '<').replace(/>/g, '>')
59
60const sum = (xs: Iterable<number>) => {
61 let t = 0
62 for (const x of xs) t += x
63 return t
64}
65
66const FAMILY_HUE: Record<string, number> = { opus: 16, sonnet: 212, haiku: 152, fable: 276 }
67
68// One colour per model: family sets the hue, newer versions are brighter.
69export const colorMap = (ids: string[]) => {
70 const out: Record<string, string> = {}
71 const seen: Record<string, number> = {}
72 for (const id of ids) {
73 const fam = /^claude-([a-z]+)-/.exec(id)?.[1] ?? 'x'
74 const i = seen[fam] ?? 0
75 seen[fam] = i + 1
76 const hue = (FAMILY_HUE[fam] ?? 46) + i * 13
77 out[id] = `hsl(${hue} ${Math.max(45, 82 - i * 6)}% ${Math.max(40, 62 - i * 5)}%)`
78 }
79 return out
80}
81
82export type Dash = {
83 today: string
84 from: string
85 range: RangeKey
86 first: string
87 ids: string[]
88 color: Record<string, string>
89 perDay: Map<string, Record<string, number>>
90 visible: (date: string) => Record<string, number>
91 total: (date: string) => number
92 inRange: (date: string) => boolean
93 rangeTotal: number
94 rangeByModel: [string, number][]
95 rangeSessions: number
96 rangeActive: number
97 rangeSpan: number
98 streakBest: number
99 streakNow: number
100 busiest?: [string, number]
101 allTotal: number
102 allByModel: [string, number][]
103 allSessions: number
104 allActive: number
105 allSpan: number
106 allBusiest?: [string, number]
107 hours: number[]
108 peakHour: number
109 types: { input: number; output: number; read: number; write: number }
110 longestSession: number
111 hpTimes: number
112 cacheRate: number
113 perSession: number
114 weekday: string
115 liveFrom?: string
116}
117
118export const derive = (stats: Stats, live: Live | null, range: RangeKey, hidden: string[], today: string): Dash => {
119 const perDay = new Map<string, Record<string, number>>()
120 for (const d of stats.dailyModelTokens) perDay.set(d.date, { ...d.tokensByModel })
121 const sessionsOn = new Map<string, number>()
122 const activeSet = new Set<string>()
123 for (const d of stats.dailyActivity) {
124 sessionsOn.set(d.date, d.sessionCount)
125 if (d.messageCount > 0) activeSet.add(d.date)
126 }
127 let liveFrom: string | undefined
128 if (live) {
129 for (const [date, models] of Object.entries(live.days)) {
130 if (date <= stats.lastComputedDate) continue
131 perDay.set(date, models)
132 sessionsOn.set(date, live.sessions[date] ?? 0)
133 liveFrom = !liveFrom || date < liveFrom ? date : liveFrom
134 }
135 }
136 for (const [date, models] of perDay) if (sum(Object.values(models)) > 0) activeSet.add(date)
137
138 const everyModel = new Map<string, number>()
139 for (const models of perDay.values()) for (const [id, n] of Object.entries(models)) everyModel.set(id, (everyModel.get(id) ?? 0) + n)
140 const ids = [...everyModel.entries()].sort((a, b) => b[1] - a[1]).map(x => x[0])
141 const color = colorMap(ids)
142 const isHidden = new Set(hidden)
143
144 const visible = (date: string) => {
145 const out: Record<string, number> = {}
146 for (const [id, n] of Object.entries(perDay.get(date) ?? {})) if (!isHidden.has(id)) out[id] = n
147 return out
148 }
149 const total = (date: string) => sum(Object.values(visible(date)))
150
151 const dates = [...perDay.keys()].sort()
152 const first = (stats.firstSessionDate ?? dates[0] ?? today).slice(0, 10)
153 const from = range === 'all' ? first : addDays(today, -(Number(range) - 1))
154 const inRange = (date: string) => date >= from && date <= today
155
156 const rangeBy = new Map<string, number>()
157 const allBy = new Map<string, number>()
158 let busiest: [string, number] | undefined
159 let allBusiest: [string, number] | undefined
160 const weekTotals = [0, 0, 0, 0, 0, 0, 0]
161 for (const date of dates) {
162 const t = total(date)
163 if (!allBusiest || t > allBusiest[1]) allBusiest = [date, t]
164 weekTotals[new Date(ms(date)).getUTCDay()]! += t
165 for (const [id, n] of Object.entries(visible(date))) allBy.set(id, (allBy.get(id) ?? 0) + n)
166 if (!inRange(date)) continue
167 if (!busiest || t > busiest[1]) busiest = [date, t]
168 for (const [id, n] of Object.entries(visible(date))) rangeBy.set(id, (rangeBy.get(id) ?? 0) + n)
169 }
170 const byCount = (m: Map<string, number>) => [...m.entries()].filter(x => x[1] > 0).sort((a, b) => b[1] - a[1])
171
172 let rangeSessions = 0
173 let rangeActive = 0
174 let allSessions = 0
175 for (const [date, n] of sessionsOn) {
176 allSessions += n
177 if (inRange(date)) rangeSessions += n
178 }
179 for (const date of activeSet) if (inRange(date)) rangeActive++
180 allSessions = Math.max(allSessions, stats.totalSessions + (liveFrom ? sum(Object.entries(live?.sessions ?? {}).filter(([k]) => k > stats.lastComputedDate).map(x => x[1])) : 0))
181
182 const sorted = [...activeSet].sort()
183 let streakBest = 0
184 let run = 0
185 for (let i = 0; i < sorted.length; i++) {
186 run = i > 0 && ms(sorted[i]!) - ms(sorted[i - 1]!) === DAY ? run + 1 : 1
187 streakBest = Math.max(streakBest, run)
188 }
189 let streakNow = 0
190 let at = activeSet.has(today) ? today : addDays(today, -1)
191 while (activeSet.has(at)) {
192 streakNow++
193 at = addDays(at, -1)
194 }
195
196 const hours = Array.from({ length: 24 }, (_, h) => stats.hourCounts?.[String(h)] ?? 0)
197 const peakHour = hours.indexOf(Math.max(...hours))
198 const use = Object.values(stats.modelUsage)
199 const types = {
200 input: sum(use.map(u => u.inputTokens)),
201 output: sum(use.map(u => u.outputTokens)),
202 read: sum(use.map(u => u.cacheReadInputTokens)),
203 write: sum(use.map(u => u.cacheCreationInputTokens)),
204 }
205 const allTotal = sum(allBy.values())
206 const topDay = weekTotals.indexOf(Math.max(...weekTotals))
207
208 return {
209 today, from, range, first, ids, color, perDay, visible, total, inRange,
210 rangeTotal: sum(rangeBy.values()),
211 rangeByModel: byCount(rangeBy),
212 rangeSessions, rangeActive,
213 rangeSpan: Math.round((ms(today) - ms(from)) / DAY) + 1,
214 streakBest, streakNow, busiest,
215 allTotal,
216 allByModel: byCount(allBy),
217 allSessions,
218 allActive: activeSet.size,
219 allSpan: Math.round((ms(today) - ms(first)) / DAY) + 1,
220 allBusiest,
221 hours, peakHour, types,
222 longestSession: stats.longestSession?.duration ?? 0,
223 hpTimes: Math.round((types.input + types.output) / HARRY_POTTER),
224 cacheRate: types.read / Math.max(1, types.input + types.read + types.write),
225 perSession: allTotal / Math.max(1, allSessions),
226 weekday: WEEKDAYS[topDay] ?? '',
227 liveFrom,
228 }
229}
230
231/* ---------- drawing ---------- */
232
233const BG = '#0b0d12'
234const CARD = '#141720'
235const EDGE = '#232838'
236const DIM = '#8b92a5'
237const ACCENT = '#d97757'
238
239const CSS = `
240text{font-family:-apple-system,BlinkMacSystemFont,"SF Pro Text",system-ui,sans-serif;fill:#e8eaf0}
241.dim{fill:${DIM}}.b{font-weight:700}.s{font-weight:600}.n{font-variant-numeric:tabular-nums}
242.d .ro{opacity:0}.d:hover .ro{opacity:1}
243svg:hover .def{opacity:0}
244.cell{transform-box:fill-box;transform-origin:center;animation:pop .5s cubic-bezier(.2,.9,.3,1.2) both}
245.cell:hover{stroke:#fff;stroke-width:1.4}
246.hl{fill:#fff;fill-opacity:0}.d:hover .hl{fill-opacity:.07}
247.g{transform-box:fill-box;transform-origin:50% 100%;animation:grow .7s cubic-bezier(.2,.8,.2,1) both}
248.f{animation:fade .7s ease both}
249.sl{transition:transform .15s;transform-origin:var(--cx) var(--cy)}
250.sl:hover{transform:scale(1.045)}
251.hv{transition:opacity .15s}.hv:hover{opacity:.78}
252@keyframes pop{from{opacity:0;transform:scale(.3)}to{opacity:1;transform:scale(1)}}
253@keyframes grow{from{transform:scaleY(0)}to{transform:scaleY(1)}}
254@keyframes fade{from{opacity:0}to{opacity:1}}
255`
256
257const frame = (w: number, h: number, body: string, defs = '') =>
258 `<svg xmlns="http://www.w3.org/2000/svg" viewBox="0 0 ${w} ${h}" width="${w}" height="${h}">` +
259 `<defs><style>${CSS}</style>` +
260 `<linearGradient id="ag" x1="0" y1="0" x2="1" y2="1"><stop offset="0" stop-color="#ffb58f"/><stop offset="1" stop-color="#d9573f"/></linearGradient>` +
261 `<linearGradient id="ar" x1="0" y1="0" x2="0" y2="1"><stop offset="0" stop-color="${ACCENT}" stop-opacity=".55"/><stop offset="1" stop-color="${ACCENT}" stop-opacity="0"/></linearGradient>` +
262 `${defs}</defs>${body}</svg>`
263
264const card = (x: number, y: number, w: number, h: number, fill = CARD) =>
265 `<rect x="${x}" y="${y}" width="${w}" height="${h}" rx="14" fill="${fill}" stroke="${EDGE}"/>`
266
267const title = (t: string, sub = '') =>
268 `<text x="20" y="28" font-size="13" class="s">${esc(t)}</text>` +
269 (sub ? `<text x="700" y="28" font-size="11" class="dim" text-anchor="end">${esc(sub)}</text>` : '')
270
271const rangeLabel = (d: Dash) => (d.range === 'all' ? 'all time' : `last ${d.range} days`)
272
273const shareOf = (part: number, whole: number) => Math.round((part / Math.max(1, whole)) * 100) + '%'
274
275export const hero = (d: Dash) => {
276 const tiles: [string, string, string, string][] = [
277 ['TOKENS', compact(d.rangeTotal), rangeLabel(d), 'url(#ag)'],
278 ['SESSIONS', compact(d.rangeSessions), d.rangeSessions ? `${compact(d.rangeTotal / Math.max(1, d.rangeSessions))} tokens each` : 'none yet', '#e8eaf0'],
279 ['ACTIVE DAYS', `${d.rangeActive}`, `of ${d.rangeSpan} days`, '#e8eaf0'],
280 ['STREAK', `${d.streakNow}`, `🔥 best ever ${d.streakBest} days`, '#e8eaf0'],
281 ]
282 const w = 171
283 const body = tiles
284 .map(([label, value, sub, fill], i) => {
285 const x = i * (w + 12)
286 return (
287 `<g class="f" style="animation-delay:${i * 90}ms">${card(x + 0.5, 0.5, w, 103)}` +
288 `<text x="${x + 18}" y="30" font-size="10.5" class="dim s" letter-spacing="1.2">${label}</text>` +
289 `<text x="${x + 18}" y="68" font-size="34" class="b n" fill="${fill}" style="fill:${fill}">${esc(value)}</text>` +
290 `<text x="${x + 18}" y="89" font-size="11.5" class="dim">${esc(sub)}</text></g>`
291 )
292 })
293 .join('')
294 return frame(720, 105, body)
295}
296
297export const heatmap = (d: Dash) => {
298 const endMs = ms(d.today)
299 const sinceFirst = Math.ceil((endMs - ms(d.first)) / (7 * DAY)) + 1
300 const weeks = Math.max(14, Math.min(53, sinceFirst))
301 const step = Math.min(34, 640 / weeks)
302 const size = step - 2
303 const left = 54
304 const top = 76
305 const height = Math.round(top + 7 * step + 42)
306 const start = endMs - ((weeks - 1) * 7 + new Date(endMs).getUTCDay()) * DAY
307
308 const days: { date: string; v: number }[] = []
309 for (let t = start; t <= endMs; t += DAY) days.push({ date: iso(t), v: d.total(iso(t)) })
310 const live = days.map(x => x.v).filter(v => v > 0).sort((a, b) => a - b)
311 const cut = [0.2, 0.4, 0.6, 0.8].map(q => live[Math.floor(q * (live.length - 1))] ?? 0)
312 const shades = ['#4b2b25', '#8a4733', '#c2593a', '#e8744c', '#ffa27a']
313 const shade = (v: number) => (v <= 0 ? '#1d2230' : shades[v <= cut[0]! ? 0 : v <= cut[1]! ? 1 : v <= cut[2]! ? 2 : v <= cut[3]! ? 3 : 4])
314
315 let cells = ''
316 let months = ''
317 let lastMonth = -1
318 let lastLabel = -100
319 days.forEach(({ date, v }, i) => {
320 const w = Math.floor(i / 7)
321 const row = i % 7
322 const x = left + w * step
323 const y = top + row * step
324 if (row === 0) {
325 const month = Number(date.slice(5, 7))
326 if (month !== lastMonth) {
327 if (x - lastLabel >= 30) {
328 months += `<text x="${x}" y="68" font-size="10.5" class="dim">${MONTHS[month - 1]}</text>`
329 lastLabel = x
330 }
331 lastMonth = month
332 }
333 }
334 const dim = d.range !== 'all' && !d.inRange(date) ? ' opacity=".28"' : ''
335 const isPeak = d.busiest && d.busiest[0] === date && v > 0
336 const stroke = isPeak ? ' stroke="#ffd166" stroke-width="1.6"' : ''
337 const rect = `<rect class="cell" x="${x.toFixed(1)}" y="${y.toFixed(1)}" width="${size.toFixed(1)}" height="${size.toFixed(1)}" rx="${(size / 4.2).toFixed(1)}" fill="${shade(v)}"${stroke}${dim} style="animation-delay:${Math.round(w * 11 + row * 6)}ms"/>`
338 if (v <= 0) {
339 cells += rect
340 return
341 }
342 const parts = Object.entries(d.visible(date))
343 .filter(([, n]) => n > 0)
344 .sort((a, b) => b[1] - a[1])
345 .slice(0, 3)
346 .map(([id, n]) => `${modelName(id)} ${compact(n)}`)
347 cells += `<g class="d">${rect}<text class="ro" x="20" y="52" font-size="12.5">${esc(longDay(date))} · <tspan class="b">${compact(v)}</tspan> tokens<tspan class="dim"> — ${esc(parts.join(' · '))}</tspan></text></g>`
348 })
349
350 const labels = [1, 3, 5].map(r => `<text x="20" y="${(top + r * step + 9).toFixed(1)}" font-size="9.5" class="dim">${['Mon', 'Wed', 'Fri'][(r - 1) / 2]}</text>`).join('')
351 const legend =
352 `<text x="${680 - 148}" y="${top + 7 * step + 22}" font-size="10.5" class="dim">Less</text>` +
353 ['#1d2230', ...shades].map((c, i) => `<rect x="${680 - 118 + i * 15}" y="${top + 7 * step + 13}" width="11" height="11" rx="2.5" fill="${c}"/>`).join('') +
354 `<text x="${680 - 20}" y="${top + 7 * step + 22}" font-size="10.5" class="dim">More</text>`
355 const note = d.busiest ? `🏔 busiest ${shortDay(d.busiest[0])}` : ''
356 const body =
357 card(0.5, 0.5, 719, height - 2) +
358 title('Daily activity', weeks >= 53 ? 'tokens per day, past year' : 'tokens per day, since you started') +
359 `<text class="def dim" x="20" y="52" font-size="12.5">Hover a day for the details</text>` +
360 months + labels + cells + legend +
361 `<text x="${left}" y="${top + 7 * step + 22}" font-size="10.5" class="dim">${esc(note)}</text>`
362 return frame(720, height, body)
363}
364
365export const facts = (d: Dash) => {
366 const [bird, night] =
367 d.peakHour < 5 || d.peakHour >= 22 ? ['🦉', 'Night owl'] : d.peakHour < 9 ? ['🐦', 'Early bird'] : d.peakHour < 18 ? ['☕', 'Daytime coder'] : ['🌆', 'Evening coder']
368 const items: [string, string, string, string][] = [
369 ['🏔', 'Biggest day', d.allBusiest ? compact(d.allBusiest[1]) : '–', d.allBusiest ? longDay(d.allBusiest[0]) : ''],
370 ['⏳', 'Longest session', duration(d.longestSession), 'one session, still going'],
371 ['📚', 'Harry Potter', `${d.hpTimes.toLocaleString('en-US')}×`, 'your prompts and replies in books'],
372 [bird, night, hourName(d.peakHour), 'your most active hour'],
373 ['⚡', 'Cache hit rate', Math.round(d.cacheRate * 100) + '%', 'of context was reused, not re-read'],
374 ['📆', 'Favorite day', d.weekday, 'most tokens, week over week'],
375 ]
376 const w = 354
377 const body = items
378 .map(([emoji, label, value, sub], i) => {
379 const x = (i % 2) * (w + 12)
380 const y = Math.floor(i / 2) * 84
381 return (
382 `<g class="f hv" style="animation-delay:${i * 70}ms">${card(x + 0.5, y + 0.5, w, 76)}` +
383 `<text x="${x + 20}" y="${y + 48}" font-size="28">${emoji}</text>` +
384 `<text x="${x + 64}" y="${y + 29}" font-size="11" class="dim s" letter-spacing=".8">${esc(label.toUpperCase())}</text>` +
385 `<text x="${x + 64}" y="${y + 53}" font-size="22" class="b n">${esc(value)}</text>` +
386 `<text x="${x + 64}" y="${y + 69}" font-size="10.5" class="dim">${esc(sub)}</text></g>`
387 )
388 })
389 .join('')
390 return frame(720, 252, body)
391}
392
393type Bucket = { label: string; segs: [string, number][]; total: number }
394
395const buckets = (d: Dash): Bucket[] => {
396 const out: Bucket[] = []
397 const make = (label: string, dates: string[]): Bucket => {
398 const by = new Map<string, number>()
399 for (const date of dates) for (const [id, n] of Object.entries(d.visible(date))) by.set(id, (by.get(id) ?? 0) + n)
400 const segs = d.ids.filter(id => (by.get(id) ?? 0) > 0).map(id => [id, by.get(id) ?? 0] as [string, number])
401 return { label, segs, total: sum(segs.map(s => s[1])) }
402 }
403 if (d.range === 'all') {
404 for (let t = ms(d.first); t <= ms(d.today); t += 7 * DAY) {
405 const dates = Array.from({ length: 7 }, (_, k) => iso(t + k * DAY)).filter(x => x <= d.today)
406 out.push(make(`${shortDay(dates[0]!)} – ${shortDay(dates[dates.length - 1]!)}`, dates))
407 }
408 } else {
409 for (let date = d.from; date <= d.today; date = addDays(date, 1)) out.push(make(shortDay(date), [date]))
410 }
411 return out
412}
413
414export const trends = (d: Dash) => {
415 const data = buckets(d)
416 const x0 = 56
417 const x1 = 700
418 const y0 = 76
419 const y1 = 246
420 const max = Math.max(1, ...data.map(b => b.total))
421 const nice = (() => {
422 const p = Math.pow(10, Math.floor(Math.log10(max)))
423 return [1, 2, 2.5, 5, 10].map(m => m * p).find(v => v >= max) ?? max
424 })()
425 const slot = (x1 - x0) / Math.max(1, data.length)
426 const bw = Math.max(1.5, slot * 0.74)
427 const yOf = (v: number) => y1 - (v / nice) * (y1 - y0)
428
429 const grid = [0, 0.25, 0.5, 0.75, 1]
430 .map(f => `<line x1="${x0}" x2="${x1}" y1="${yOf(nice * f).toFixed(1)}" y2="${yOf(nice * f).toFixed(1)}" stroke="${EDGE}"/>` + `<text x="${x0 - 8}" y="${(yOf(nice * f) + 3.5).toFixed(1)}" font-size="10" class="dim" text-anchor="end">${compact(nice * f)}</text>`)
431 .join('')
432
433 const bars = data
434 .map((b, i) => {
435 const x = x0 + i * slot + (slot - bw) / 2
436 let cum = 0
437 const segs = b.segs
438 .map(([id, n]) => {
439 const h = (n / nice) * (y1 - y0)
440 const y = y1 - ((cum + n) / nice) * (y1 - y0)
441 cum += n
442 return `<rect x="${x.toFixed(1)}" y="${y.toFixed(1)}" width="${bw.toFixed(1)}" height="${Math.max(0.6, h).toFixed(1)}" fill="${d.color[id]}"/>`
443 })
444 .join('')
445 const top = b.segs.slice(0, 3).map(([id, n]) => `${modelName(id)} ${compact(n)}`).join(' · ')
446 const tip = b.total > 0 ? `${esc(b.label)} · <tspan class="b">${compact(b.total)}</tspan><tspan class="dim"> — ${esc(top)}</tspan>` : `${esc(b.label)} · no usage`
447 return (
448 `<g class="d"><rect class="hl" x="${(x0 + i * slot).toFixed(1)}" y="${y0 - 6}" width="${slot.toFixed(1)}" height="${y1 - y0 + 6}"/>` +
449 `<g class="g" style="animation-delay:${Math.min(600, i * 9)}ms">${segs}</g>` +
450 `<text class="ro" x="20" y="54" font-size="12.5">${tip}</text></g>`
451 )
452 })
453 .join('')
454
455 let line = ''
456 if (d.range !== 'all' && data.length > 7) {
457 const pts = data.map((_, i) => {
458 const win = data.slice(Math.max(0, i - 6), i + 1)
459 const avg = sum(win.map(b => b.total)) / win.length
460 return `${(x0 + i * slot + slot / 2).toFixed(1)},${yOf(avg).toFixed(1)}`
461 })
462 line = `<polyline class="f" style="animation-delay:500ms" points="${pts.join(' ')}" fill="none" stroke="#fff" stroke-opacity=".75" stroke-width="1.6" stroke-linejoin="round" stroke-dasharray="4 3"/>`
463 }
464
465 const every = Math.max(1, Math.ceil(data.length / 8))
466 const xl = data
467 .map((b, i) => (i % every === 0 ? `<text x="${(x0 + i * slot + slot / 2).toFixed(1)}" y="266" font-size="10" class="dim" text-anchor="middle">${esc(b.label.split(' – ')[0] ?? '')}</text>` : ''))
468 .join('')
469
470 let lx = 20
471 const legend = d.ids
472 .filter(id => data.some(b => b.segs.some(s => s[0] === id)))
473 .map(id => {
474 const w = modelName(id).length * 6.4 + 26
475 const out = `<rect x="${lx}" y="287" width="10" height="10" rx="3" fill="${d.color[id]}"/><text x="${lx + 15}" y="296" font-size="11" class="dim">${esc(modelName(id))}</text>`
476 lx += w
477 return out
478 })
479 .join('')
480 const sub = d.range === 'all' ? 'tokens per week' : line ? 'tokens per day · dashed = 7-day average' : 'tokens per day'
481 const body =
482 card(0.5, 0.5, 719, 314) + title('Token trend', sub) +
483 `<text class="def dim" x="20" y="54" font-size="12.5">Hover a bar for the day's models</text>` +
484 grid + bars + line + xl + legend
485 return frame(720, 316, body)
486}
487
488const polar = (cx: number, cy: number, r: number, a: number): [number, number] => [cx + r * Math.sin(a), cy - r * Math.cos(a)]
489
490const sector = (cx: number, cy: number, r0: number, r1: number, a0: number, a1: number) => {
491 const [x0, y0] = polar(cx, cy, r1, a0)
492 const [x1, y1] = polar(cx, cy, r1, a1)
493 const [x2, y2] = polar(cx, cy, r0, a1)
494 const [x3, y3] = polar(cx, cy, r0, a0)
495 const big = a1 - a0 > Math.PI ? 1 : 0
496 return `M${x0.toFixed(2)} ${y0.toFixed(2)}A${r1} ${r1} 0 ${big} 1 ${x1.toFixed(2)} ${y1.toFixed(2)}L${x2.toFixed(2)} ${y2.toFixed(2)}A${r0} ${r0} 0 ${big} 0 ${x3.toFixed(2)} ${y3.toFixed(2)}Z`
497}
498
499export const models = (d: Dash) => {
500 const list = d.rangeByModel
501 const all = d.rangeTotal
502 const cx = 170
503 const cy = 168
504 const arcs = list
505 .map(([id, n], i) => {
506 const before = sum(list.slice(0, i).map(x => x[1]))
507 const a0 = (before / all) * Math.PI * 2
508 const a1 = ((before + n) / all) * Math.PI * 2
509 const path = n / all > 0.9995 ? `M${cx} ${cy - 104}A104 104 0 1 1 ${cx - 0.01} ${cy - 104}L${cx - 0.01} ${cy - 66}A66 66 0 1 0 ${cx} ${cy - 66}Z` : sector(cx, cy, 66, 104, a0 + 0.012, a1 - 0.012)
510 return (
511 `<g class="d"><path class="sl" style="--cx:${cx}px;--cy:${cy}px" d="${path}" fill="${d.color[id]}" fill-rule="evenodd"/>` +
512 `<text class="ro s" x="${cx}" y="${cy - 4}" font-size="13" text-anchor="middle">${esc(modelName(id))}</text>` +
513 `<text class="ro n" x="${cx}" y="${cy + 18}" font-size="12" text-anchor="middle" style="fill:${DIM}">${shareOf(n, all)} · ${compact(n)}</text></g>`
514 )
515 })
516 .join('')
517
518 const rows = list.slice(0, 7)
519 const rowsSvg = rows
520 .map(([id, n], i) => {
521 const y = 62 + i * 33
522 return (
523 `<g class="f" style="animation-delay:${i * 60}ms"><circle cx="352" cy="${y + 7}" r="5" fill="${d.color[id]}"/>` +
524 `<text x="368" y="${y + 11}" font-size="13" class="s">${esc(modelName(id))}</text>` +
525 `<text x="700" y="${y + 11}" font-size="13" class="n" text-anchor="end">${compact(n)}</text>` +
526 `<rect x="368" y="${y + 18}" width="332" height="5" rx="2.5" fill="#1d2230"/>` +
527 `<rect x="368" y="${y + 18}" width="${((n / (list[0]?.[1] ?? 1)) * 332).toFixed(1)}" height="5" rx="2.5" fill="${d.color[id]}"/></g>`
528 )
529 })
530 .join('')
531 const empty = list.length === 0 ? `<text x="360" y="170" font-size="13" class="dim" text-anchor="middle">No tokens in this range</text>` : ''
532 const body =
533 card(0.5, 0.5, 719, 296) + title('Model mix', rangeLabel(d)) +
534 `<g class="def"><text x="${cx}" y="${cy - 2}" font-size="26" class="b n" text-anchor="middle">${compact(all)}</text><text x="${cx}" y="${cy + 18}" font-size="11" class="dim" text-anchor="middle">tokens</text></g>` +
535 arcs + rowsSvg + empty
536 return frame(720, 298, body)
537}
538
539export const types = (d: Dash) => {
540 const t = d.types
541 const parts: [string, number, string][] = [
542 ['Cache read', t.read, '#e8744c'],
543 ['Cache write', t.write, '#8a4733'],
544 ['Output', t.output, '#7aa7ff'],
545 ['Input', t.input, '#b9c4ff'],
546 ]
547 const all = sum(parts.map(p => p[1]))
548 let x = 20
549 const bar = parts
550 .map(([name, n, c]) => {
551 const w = Math.max(2, (n / all) * 680)
552 const out = `<g class="d"><rect x="${x.toFixed(1)}" y="52" width="${w.toFixed(1)}" height="22" fill="${c}"/><text class="ro" x="20" y="100" font-size="12"><tspan class="b">${name}</tspan> · ${compact(n)} · ${(n / all * 100).toFixed(1)}%</text></g>`
553 x += w
554 return out
555 })
556 .join('')
557 const key = parts
558 .map(([name, n, c], i) => `<rect x="${20 + i * 170}" y="116" width="10" height="10" rx="3" fill="${c}"/><text x="${36 + i * 170}" y="125" font-size="11" class="dim">${name} <tspan class="n s" style="fill:#e8eaf0">${compact(n)}</tspan></text>`)
559 .join('')
560 const body =
561 card(0.5, 0.5, 719, 148) + title('Where the tokens go', 'all time, as of the stats cache') +
562 `<clipPath id="bc"><rect x="20" y="52" width="680" height="22" rx="7"/></clipPath><g clip-path="url(#bc)">${bar}</g>` +
563 `<text class="def dim" x="20" y="100" font-size="12">${Math.round(d.cacheRate * 100)}% of context was reused from cache — hover a segment</text>` + key
564 return frame(720, 150, body)
565}
566
567export const clock = (d: Dash) => {
568 const cx = 170
569 const cy = 172
570 const max = Math.max(1, ...d.hours)
571 const wedges = d.hours
572 .map((n, h) => {
573 const a0 = (h / 24) * Math.PI * 2 + 0.018
574 const a1 = ((h + 1) / 24) * Math.PI * 2 - 0.018
575 const r1 = 40 + (n / max) * 72
576 const fill = h === d.peakHour ? '#ffa27a' : n / max > 0.5 ? '#e8744c' : n / max > 0.15 ? '#a5502f' : '#3a2a2c'
577 return (
578 `<g class="d"><path class="sl" style="--cx:${cx}px;--cy:${cy}px" d="${sector(cx, cy, 34, r1, a0, a1)}" fill="${fill}"/>` +
579 `<text class="ro b n" x="${cx}" y="${cy - 2}" font-size="16" text-anchor="middle">${hourName(h)}</text>` +
580 `<text class="ro n" x="${cx}" y="${cy + 16}" font-size="11" text-anchor="middle" style="fill:${DIM}">${compact(n)} messages</text></g>`
581 )
582 })
583 .join('')
584 const ticks = [0, 6, 12, 18]
585 .map(h => {
586 const [x, y] = polar(cx, cy, 128, (h / 24) * Math.PI * 2)
587 return `<text x="${x.toFixed(1)}" y="${(y + 4).toFixed(1)}" font-size="10.5" class="dim" text-anchor="middle">${['12a', '6a', '12p', '6p'][h / 6] ?? ''}</text>`
588 })
589 .join('')
590 const periods: [string, string, number][] = [
591 ['🌙', 'Night 12–6 AM', sum(d.hours.slice(0, 6))],
592 ['🌅', 'Morning 6 AM–12', sum(d.hours.slice(6, 12))],
593 ['☀️', 'Afternoon 12–6 PM', sum(d.hours.slice(12, 18))],
594 ['🌆', 'Evening 6 PM–12', sum(d.hours.slice(18, 24))],
595 ]
596 const tot = sum(periods.map(p => p[2]))
597 const topP = Math.max(...periods.map(p => p[2]))
598 const rows = periods
599 .map(([emoji, name, n], i) => {
600 const y = 82 + i * 52
601 return (
602 `<g class="f" style="animation-delay:${i * 80}ms"><text x="352" y="${y + 6}" font-size="20">${emoji}</text>` +
603 `<text x="388" y="${y}" font-size="12.5" class="s">${esc(name)}</text>` +
604 `<text x="700" y="${y}" font-size="12.5" class="n" text-anchor="end">${shareOf(n, tot)}</text>` +
605 `<rect x="388" y="${y + 9}" width="312" height="6" rx="3" fill="#1d2230"/><rect x="388" y="${y + 9}" width="${Math.max(3, (n / topP) * 312).toFixed(1)}" height="6" rx="3" fill="${n === topP ? '#ffa27a' : '#c2593a'}"/></g>`
606 )
607 })
608 .join('')
609 const body =
610 card(0.5, 0.5, 719, 312) + title('When you work', 'message activity by hour, all time') +
611 wedges + ticks +
612 `<g class="def"><text x="${cx}" y="${cy - 2}" font-size="17" class="b n" text-anchor="middle">${hourName(d.peakHour)}</text><text x="${cx}" y="${cy + 15}" font-size="10.5" class="dim" text-anchor="middle">peak hour</text></g>` +
613 rows
614 return frame(720, 314, body)
615}
616
617export const wrapped = (d: Dash) => {
618 const top = d.allByModel.slice(0, 3)
619 const night = d.peakHour < 5 || d.peakHour >= 22 ? '🦉 Night owl' : d.peakHour < 9 ? '🐦 Early bird' : d.peakHour < 18 ? '☕ Daytime coder' : '🌆 Evening coder'
620
621 const dates: string[] = []
622 for (let date = d.first; date <= d.today; date = addDays(date, 1)) dates.push(date)
623 const vals = dates.map((date, i) => {
624 const win = dates.slice(Math.max(0, i - 2), i + 1)
625 return sum(win.map(x => d.total(x))) / win.length
626 })
627 const vmax = Math.max(1, ...vals)
628 const px = (i: number) => (i / Math.max(1, vals.length - 1)) * 720
629 const py = (v: number) => 420 - (v / vmax) * 82
630 const line = vals.map((v, i) => `${i ? 'L' : 'M'}${px(i).toFixed(1)} ${py(v).toFixed(1)}`).join('')
631 const area = `${line}L720 420L0 420Z`
632
633 const podium = top
634 .map(([id, n], i) => {
635 const y = 262 + i * 28
636 return (
637 `<circle cx="394" cy="${y - 4}" r="5" fill="${d.color[id]}"/>` +
638 `<text x="408" y="${y}" font-size="14" class="s">${esc(modelName(id))}</text>` +
639 `<text x="690" y="${y}" font-size="14" class="n" text-anchor="end" style="fill:${DIM}">${compact(n)} · ${shareOf(n, d.allTotal)}</text>`
640 )
641 })
642 .join('')
643 const stat = (x: number, value: string, label: string) =>
644 `<text x="${x}" y="240" font-size="26" class="b n">${esc(value)}</text><text x="${x}" y="259" font-size="10.5" class="dim s" letter-spacing="1">${label}</text>`
645
646 const body =
647 `<rect width="720" height="440" rx="22" fill="url(#wbg)"/>` +
648 `<circle cx="610" cy="40" r="210" fill="url(#glow)"/>` +
649 `<text x="36" y="52" font-size="11.5" class="s" letter-spacing="3" style="fill:#ffb58f">YOUR CLAUDE CODE</text>` +
650 `<text x="36" y="76" font-size="12" class="dim">since ${esc(longDay(d.first))} · ${d.allSpan} days</text>` +
651 `<text x="34" y="156" font-size="78" class="b n" fill="url(#ag)" style="fill:url(#ag)" letter-spacing="-2">${compact(d.allTotal)}</text>` +
652 `<text x="36" y="184" font-size="15" class="dim">tokens, about <tspan class="s" style="fill:#e8eaf0">${d.hpTimes.toLocaleString('en-US')}×</tspan> the text of Harry Potter</text>` +
653 stat(36, compact(d.allSessions), 'SESSIONS') +
654 stat(160, String(d.allActive), 'ACTIVE DAYS') +
655 stat(280, String(d.streakBest), 'DAY STREAK') +
656 `<line x1="372" x2="372" y1="212" y2="318" stroke="#ffffff" stroke-opacity=".12"/>` +
657 podium +
658 `<text x="36" y="300" font-size="13" class="s">${night}<tspan class="dim"> · peaks at ${hourName(d.peakHour)}</tspan></text>` +
659 (d.allBusiest ? `<text x="36" y="322" font-size="13" class="s">🏔 Biggest day<tspan class="dim"> · ${esc(shortDay(d.allBusiest[0]))}, ${compact(d.allBusiest[1])} tokens</tspan></text>` : '') +
660 `<path d="${area}" fill="url(#ar)"/><path d="${line}" fill="none" stroke="${ACCENT}" stroke-width="2" stroke-linejoin="round"/>` +
661 `<text x="684" y="52" font-size="11" class="dim" text-anchor="end">${esc(longDay(d.today))}</text>`
662 const defs =
663 `<linearGradient id="wbg" x1="0" y1="0" x2="1" y2="1"><stop offset="0" stop-color="#1b1233"/><stop offset=".6" stop-color="#0f1220"/><stop offset="1" stop-color="${BG}"/></linearGradient>` +
664 `<radialGradient id="glow"><stop offset="0" stop-color="${ACCENT}" stop-opacity=".38"/><stop offset="1" stop-color="${ACCENT}" stop-opacity="0"/></radialGradient>`
665 return frame(720, 440, body, defs)
666}
667types/index.d.ts 19 lines1export type RangeKey = '7' | '30' | '90' | 'all'
2export type TabKey = 'overview' | 'trends' | 'models' | 'wrapped'
3export type LiveScan = {
4 days: Record<string, Record<string, number>>
5 sessions: Record<string, number>
6 at: number
7}
8
9declare module 'claude-code' {
10 interface PluginState {
11 'usage-stats': {
12 tab: TabKey
13 range: RangeKey
14 hidden: string[]
15 live: LiveScan | null
16 status: 'idle' | 'busy' | 'failed' }
17 }
18}
19